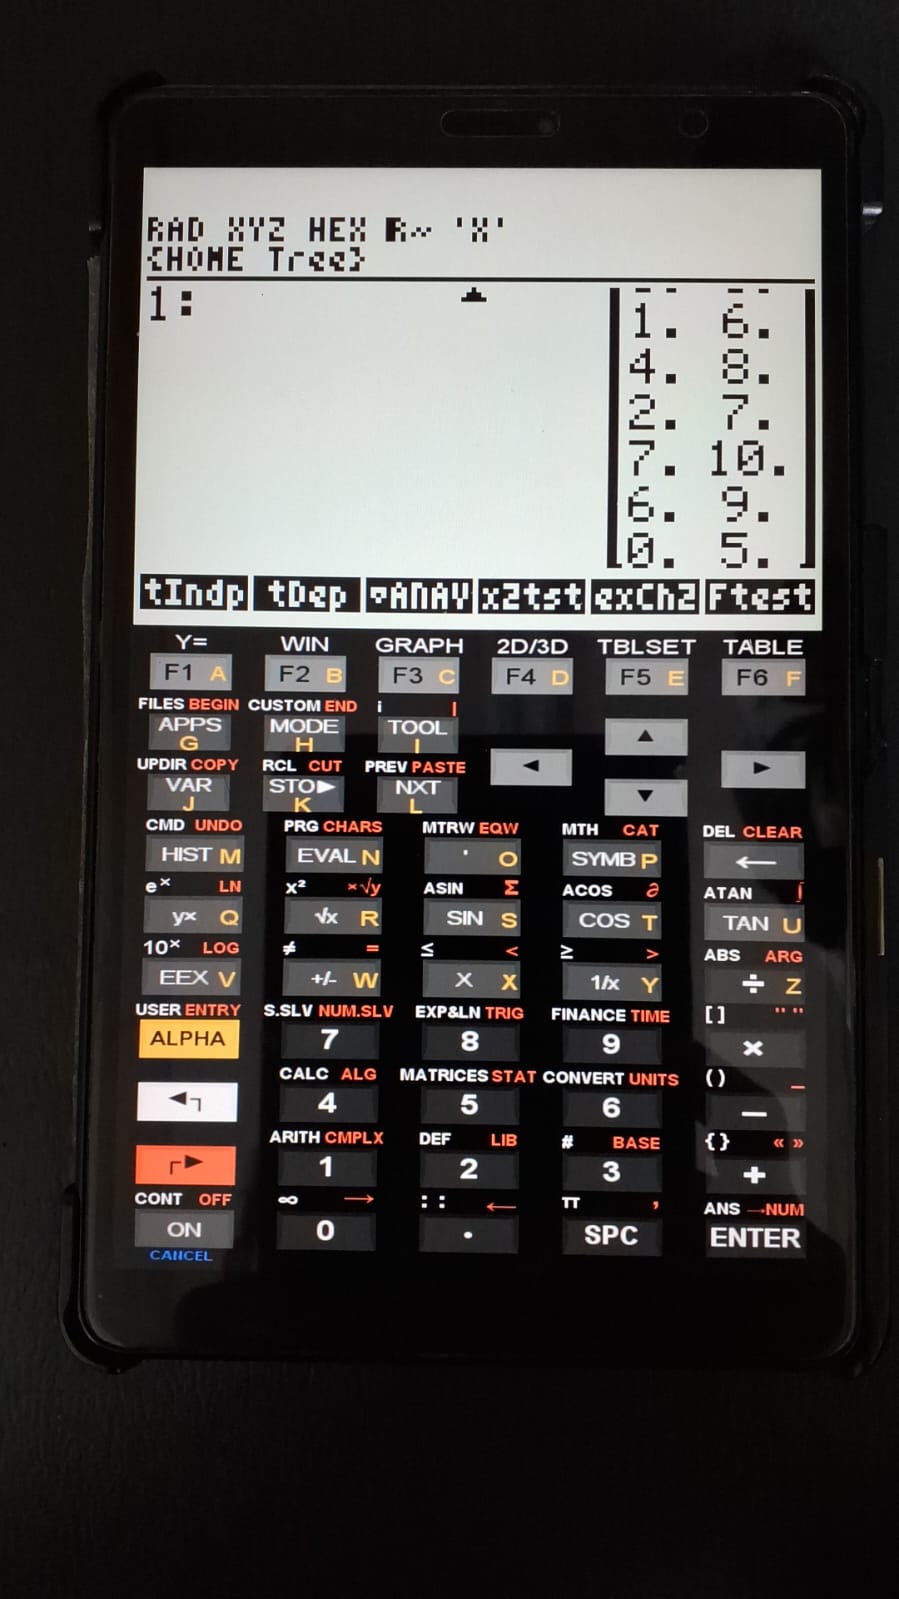
1. Enter the matrix containing the two paired datasets;
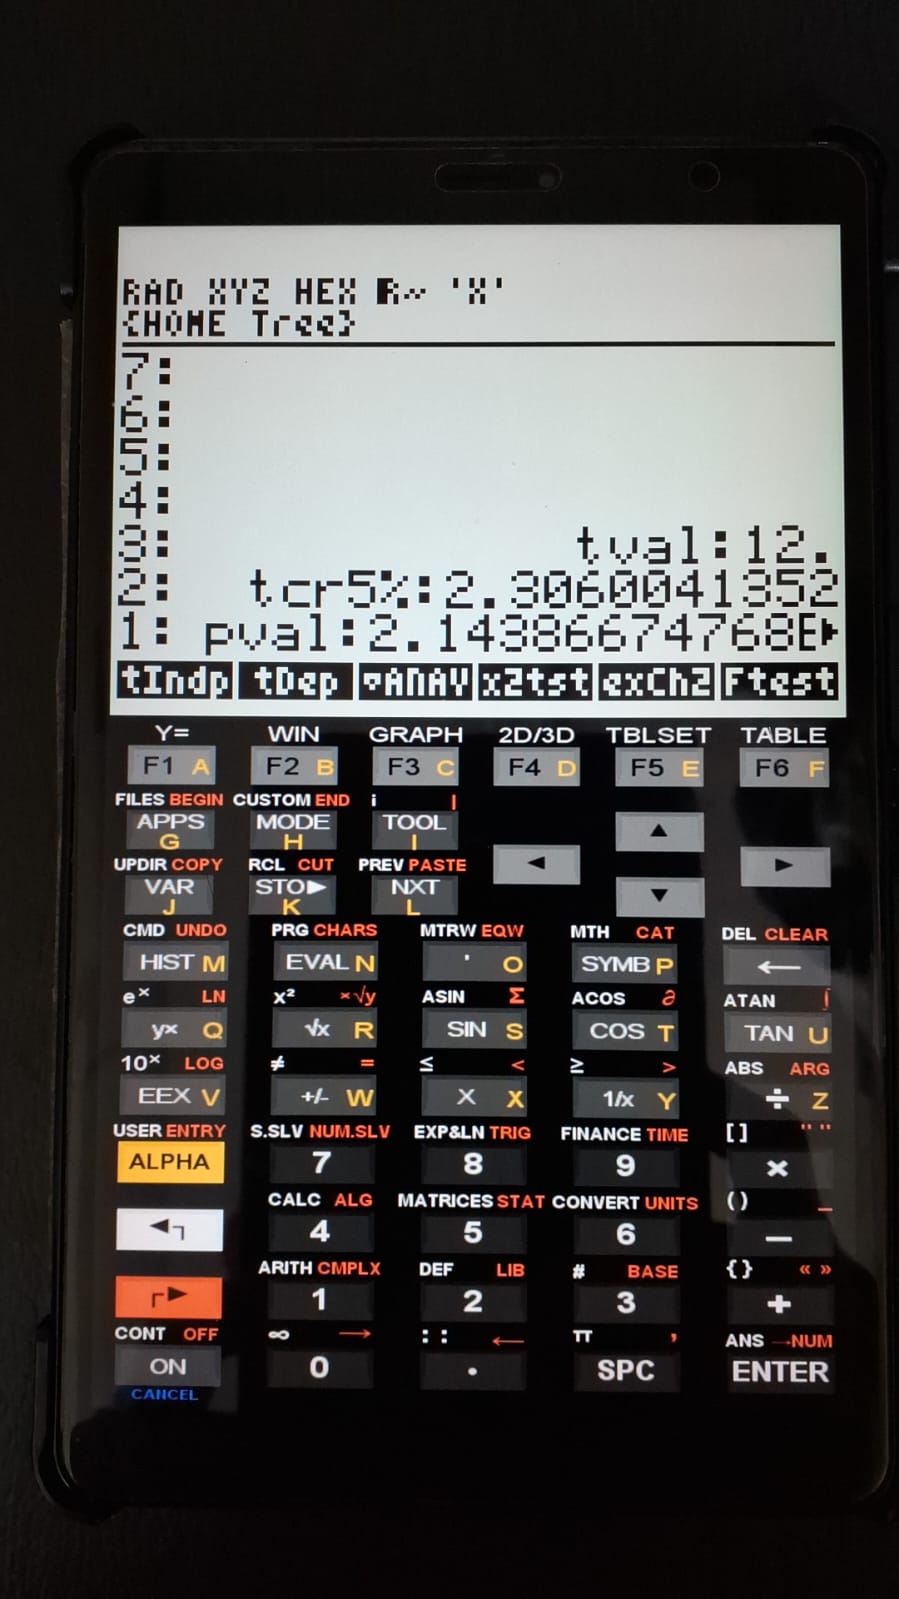
2. Run "testetDep1matrix"
# Output:
1. "tval" – calculated t statistic;
2. "tcr5%" – critical (tabulated) t value at 5%;
3. "pval" – p-value of the testStudent’s t-Test for Paired Samples
This version of Student’s t-test evaluates whether two dependent (paired) samples are statistically different. The only required input is the data matrix.
1 Equation:
\[
t = \frac{d}{\sqrt{\frac{s^2}{n}}}
\]
Where:
- d = mean difference between paired observations
- s² = variance of the differences
- n = sample size
The variance of the differences is given by:
\[ s^2 = \frac{\sum d^2 - \frac{(\sum d)^2}{n}}{n - 1} \]
2 Files:
3 Usage and example
The program performs the test at a 5% significance level.
Table — Observed values for groups A and B (Vieira, 2000).
| Group | ||||||||
|---|---|---|---|---|---|---|---|---|
| A | 2 | 3 | 5 | 1 | 4 | 2 | 7 | 6 |
| B | 7 | 6 | 8 | 6 | 8 | 7 | 10 | 9 |
The results are identical to those obtained using the HP50G’s internal form-based input and built-in algorithm.