1. Enter a matrix containing the two datasets;
2. Run "testet1matrix".

# Output:
1. "tval"   – *t* statistic;
2. "tcr5%"  – tabulated critical *t* value;
3. "pval" – *p*-value of the test.Student’s t-test for Independent Samples
Student’s t-test evaluates whether two independent samples are statistically different.
1 Equation:
\[ t = \frac{y_1 - y_2}{\sqrt{\left(\frac{1}{n_1} + \frac{1}{n_2}\right)s^2}} \]
Where:
- \(y_1\) = mean of the values in the first dataset;
- \(y_2\) = mean of the values in the second dataset;
- \(s^2\) = pooled variance.
The pooled variance is given by:
\[ s^2 = \frac{(n_1 - 1)s_1^2 + (n_2 - 1)s_2^2}{n_1 + n_2 - 2} \]
2 Files:
3 Usage and example
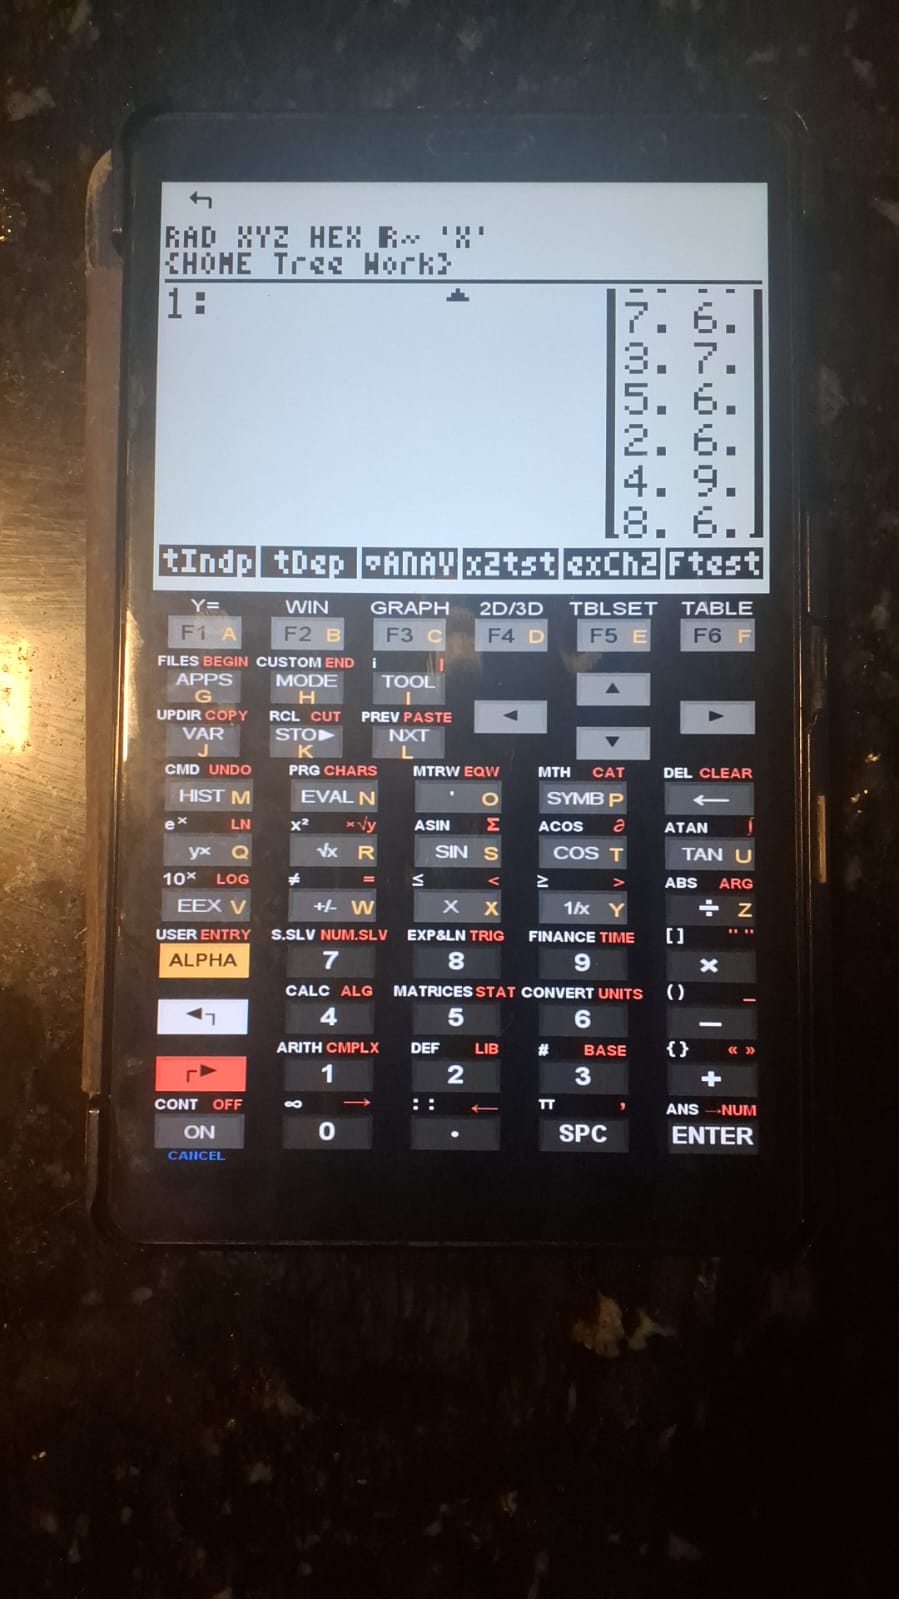
Table — Observed values for groups A and B (Vieira, 2000).
| Group | ||||||||
|---|---|---|---|---|---|---|---|---|
| A | 6 | 5 | 7 | 3 | 5 | 2 | 4 | 8 |
| B | 7 | 9 | 6 | 7 | 6 | 6 | 9 | 6 |
| \ |
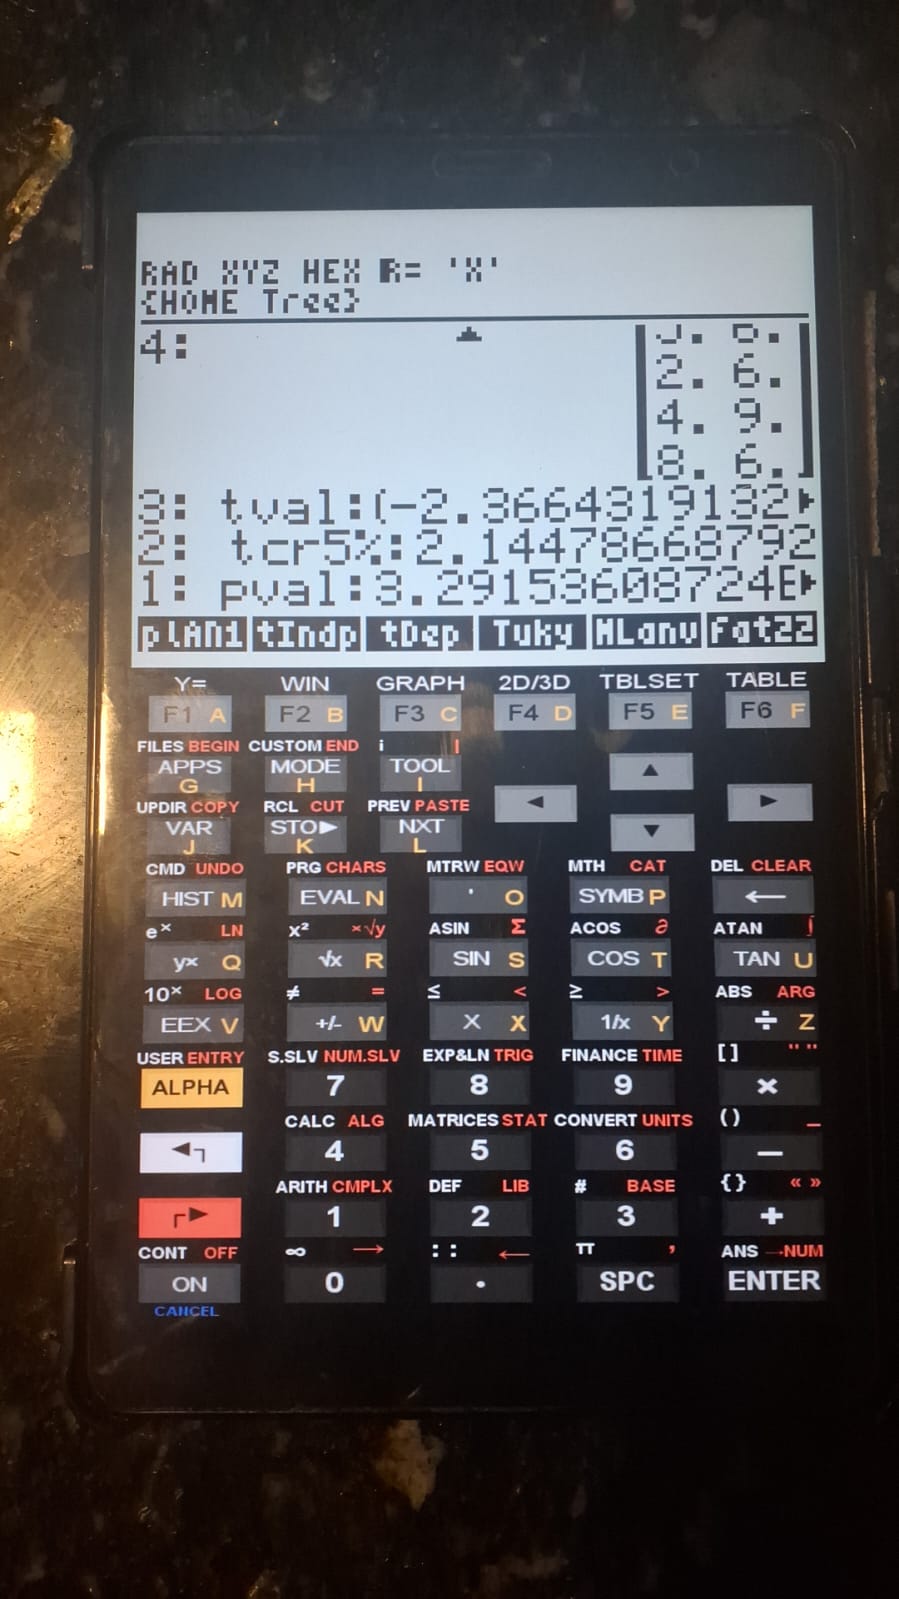
The results are consistent with those reported by Vieira (2000), with tval = −2.366 and pval = 0.036.
4 References:
- Vieira, Sônia. Analysis of Variance: ANOVA. Atlas Publishing, 2000.