# Input:
1. mathematical function;
2. minimum x-value of the function ("xi");
3. maximum x-value of the function ("xf");
4. list containing the values of the parameter "k" to be varied;
# Output:
1. animated plot of the equation with variation in "k";
2. function, values, and list remaining on the stack for further modifications.
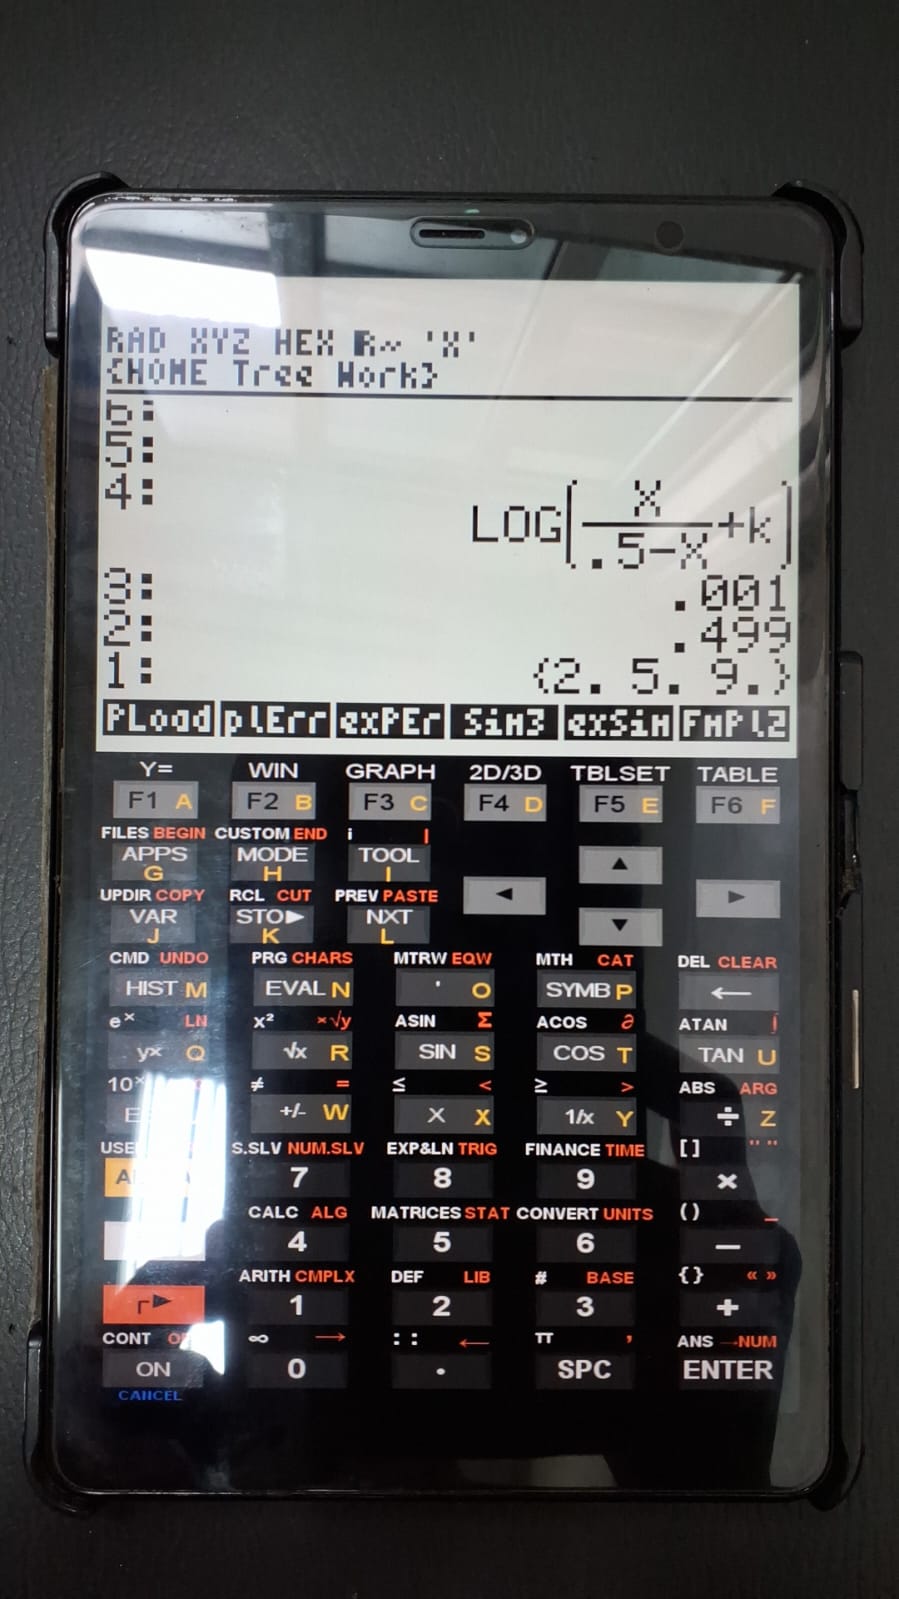
# Example:
1. Select "exSim" to load the example list;
2. Press EVAL to unpack the list;
3. Run "SimPlot".Overlay of Graphs with Variation of a Function Parameter
In some situations, it is useful to compare the behavior of a function as one of its parameters varies. The SimPlot program allows graphical visualization of overlaid profiles of an equation in which different values are assigned to a given parameter (“k”).
1 Usage and example
To use SimPlot, the following elements must be placed on the stack prior to running the program:
The figures below illustrate the program using the provided example.
2 Files: