# Input:
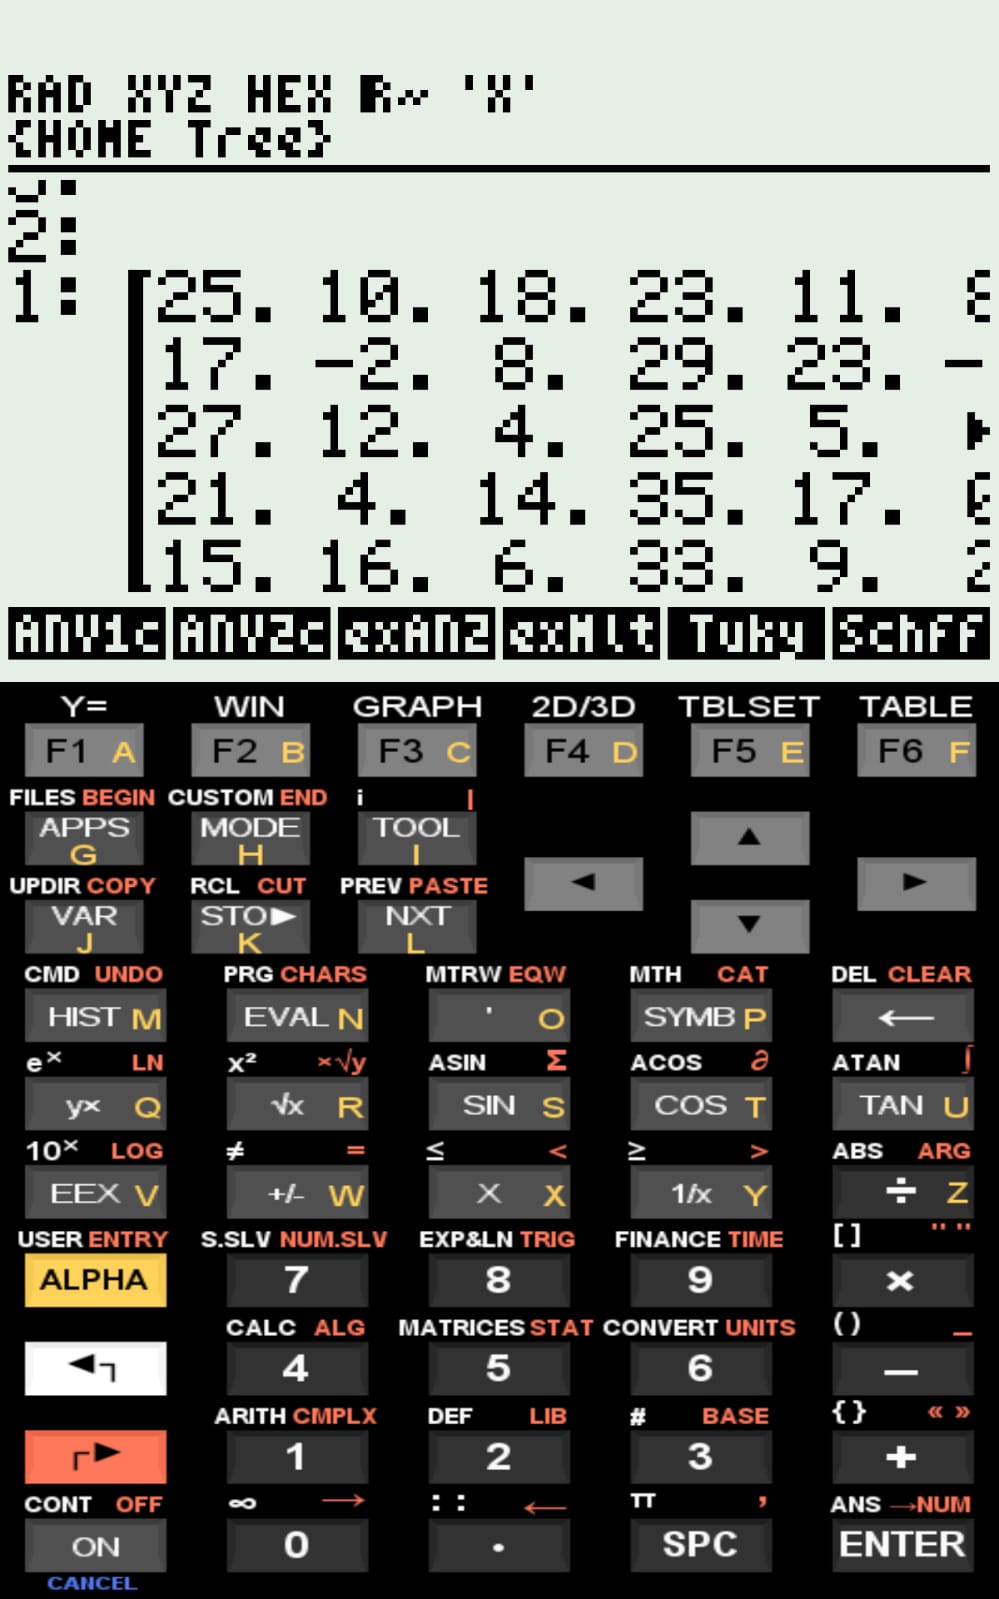
1. Enter the data matrix;
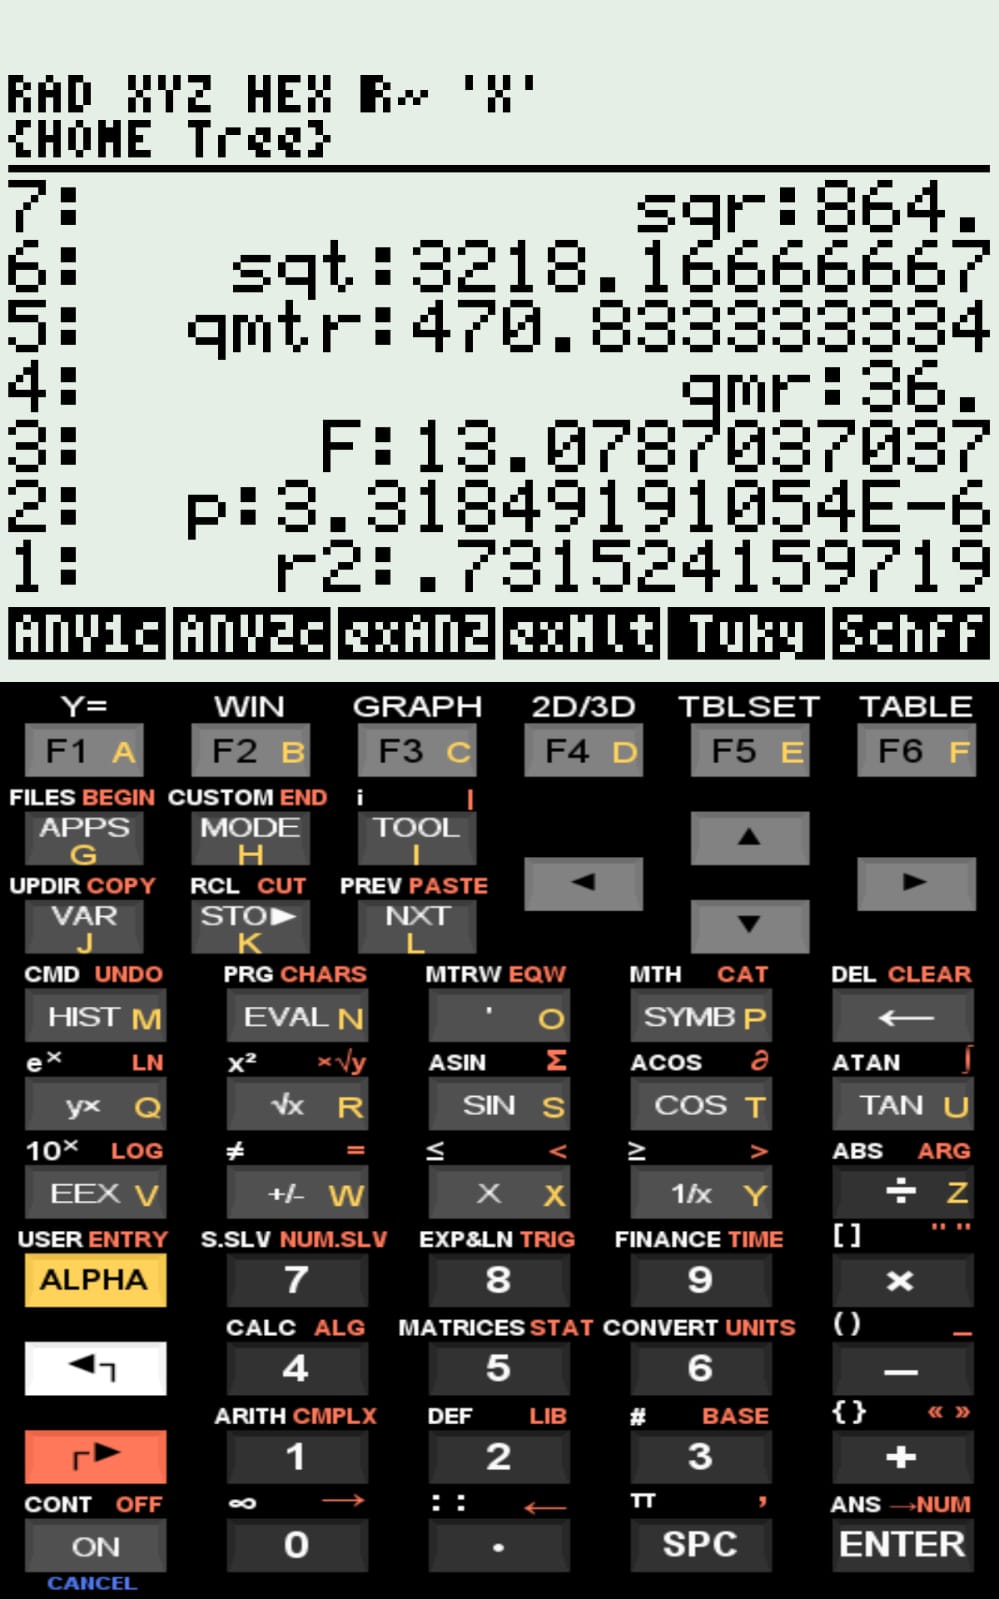
2. Run the program "1ANAVA1matrix";
3. Run the program "Schf1matrix".
# Output:
1. "contrst" - contrast value;
2. "Fval" - F distribution value;
3. "Schf5%" - critical value of the test (α = 0.05);
4. "dmS" - minimum significant difference.Scheffé Test for Multiple Comparisons
The Scheffé test is a post-hoc procedure based on the F-Snedecor distribution, used to compare a specific group against others in a sample. As a post-hoc method, it follows an ANOVA and allows the comparison of any linear contrast of means. It is often considered more general than the Tukey test, although it is more conservative and has lower statistical power.
1 Equation
For pairwise mean differences, the minimum significant difference under Scheffé’s criterion may be expressed as:
\[
dmS= \sqrt {(k-1)_{\alpha}}*\sqrt{\frac{2*qmr}{k-1}}
\]
Where:
- \(dm_S\) = minimum significant difference (Scheffé)
- \(k\) = number of groups
- \(n\) = total number of observations
- \(qmr\) = mean square of residuals (from ANOVA)
- \(r\) = number of observations per group
- \(F_{\alpha,(k-1,n-k)}\) = critical F value at significance level \(\alpha\)
To determine whether a given contrast is significant, the following statistic is evaluated:
\[
S=\sqrt{(k-1)*V_L*F}
\]
Where:
- \(S\) = critical Scheffé value
- \(F\) = value from the F-Snedecor distribution
- \(V_L\) = variance of the contrast vector
2 Files
3 Use and example
Data must be entered as a matrix, with the group to be compared placed in the last column vector.
The logic of the Scheffé test consists of calculating the contrast value (vector of mean differences) pairwise (one selected group versus each of the others), and comparing it to the predicted value from the F distribution at \(\alpha = 0.05\) (5%).
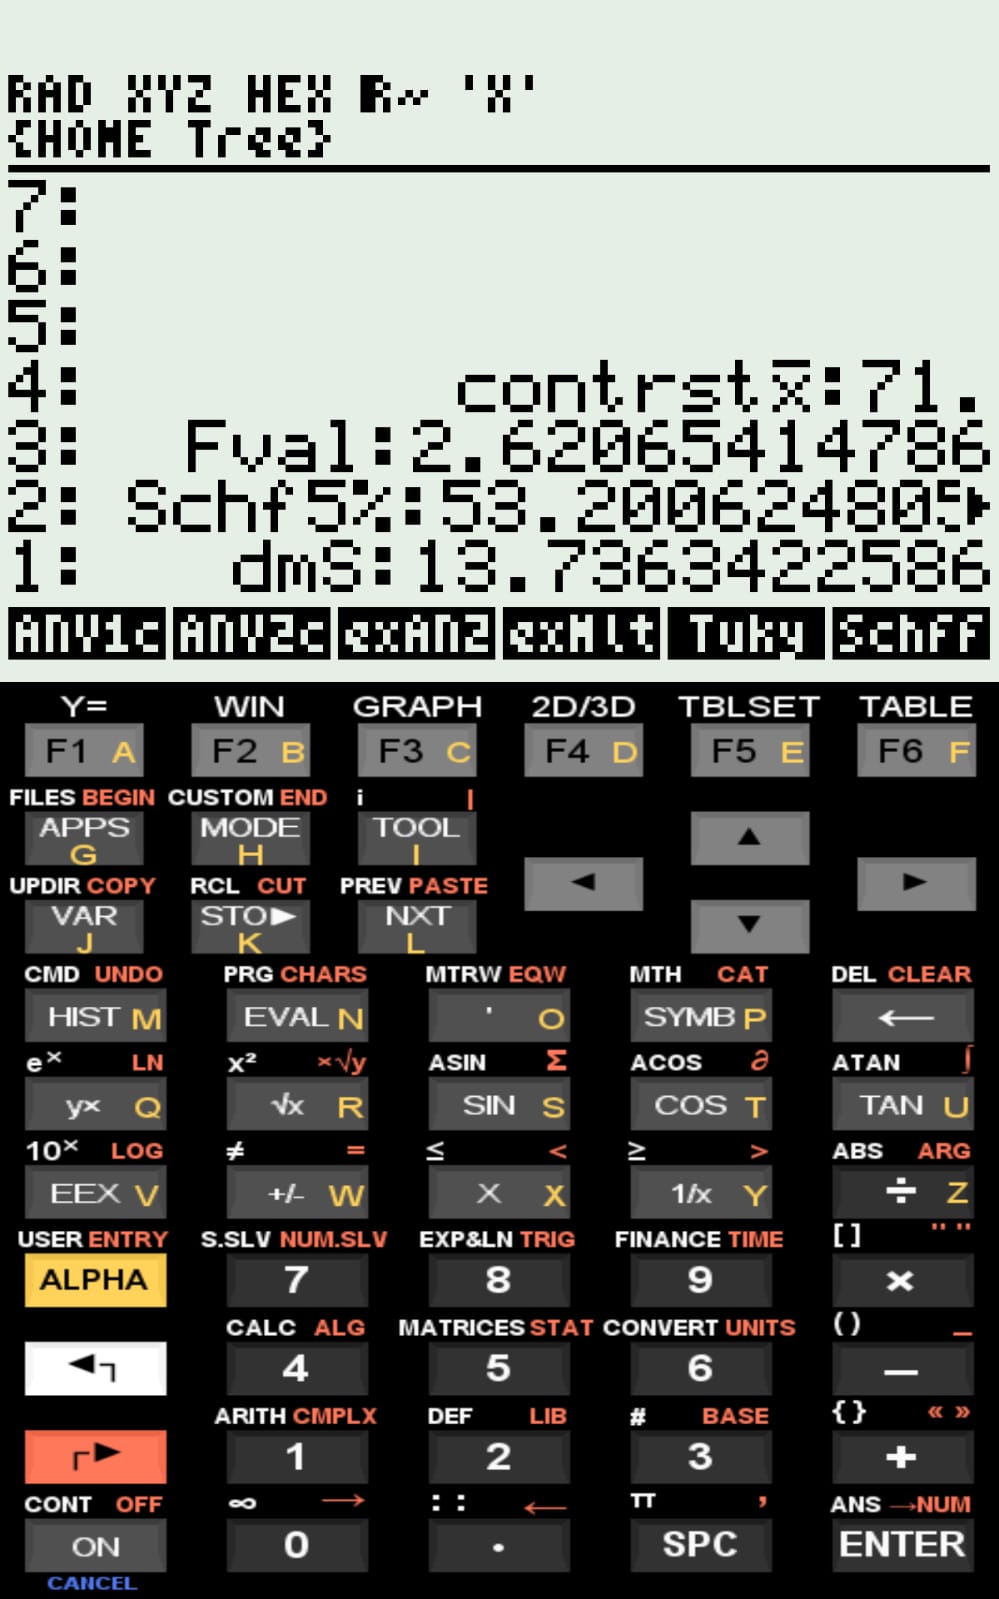
The results produced by Schf1matrix agree with the published example in Vieira (2026), yielding Schf5% = 53.20 compared to 5.194 reported in the source.
4 References
- Vieira, Sônia. Beyond F: Accurate Comparisons with the Scheffé Test. Blogspot, 2016. Accessed Feb 18, 2026.