# Inputs
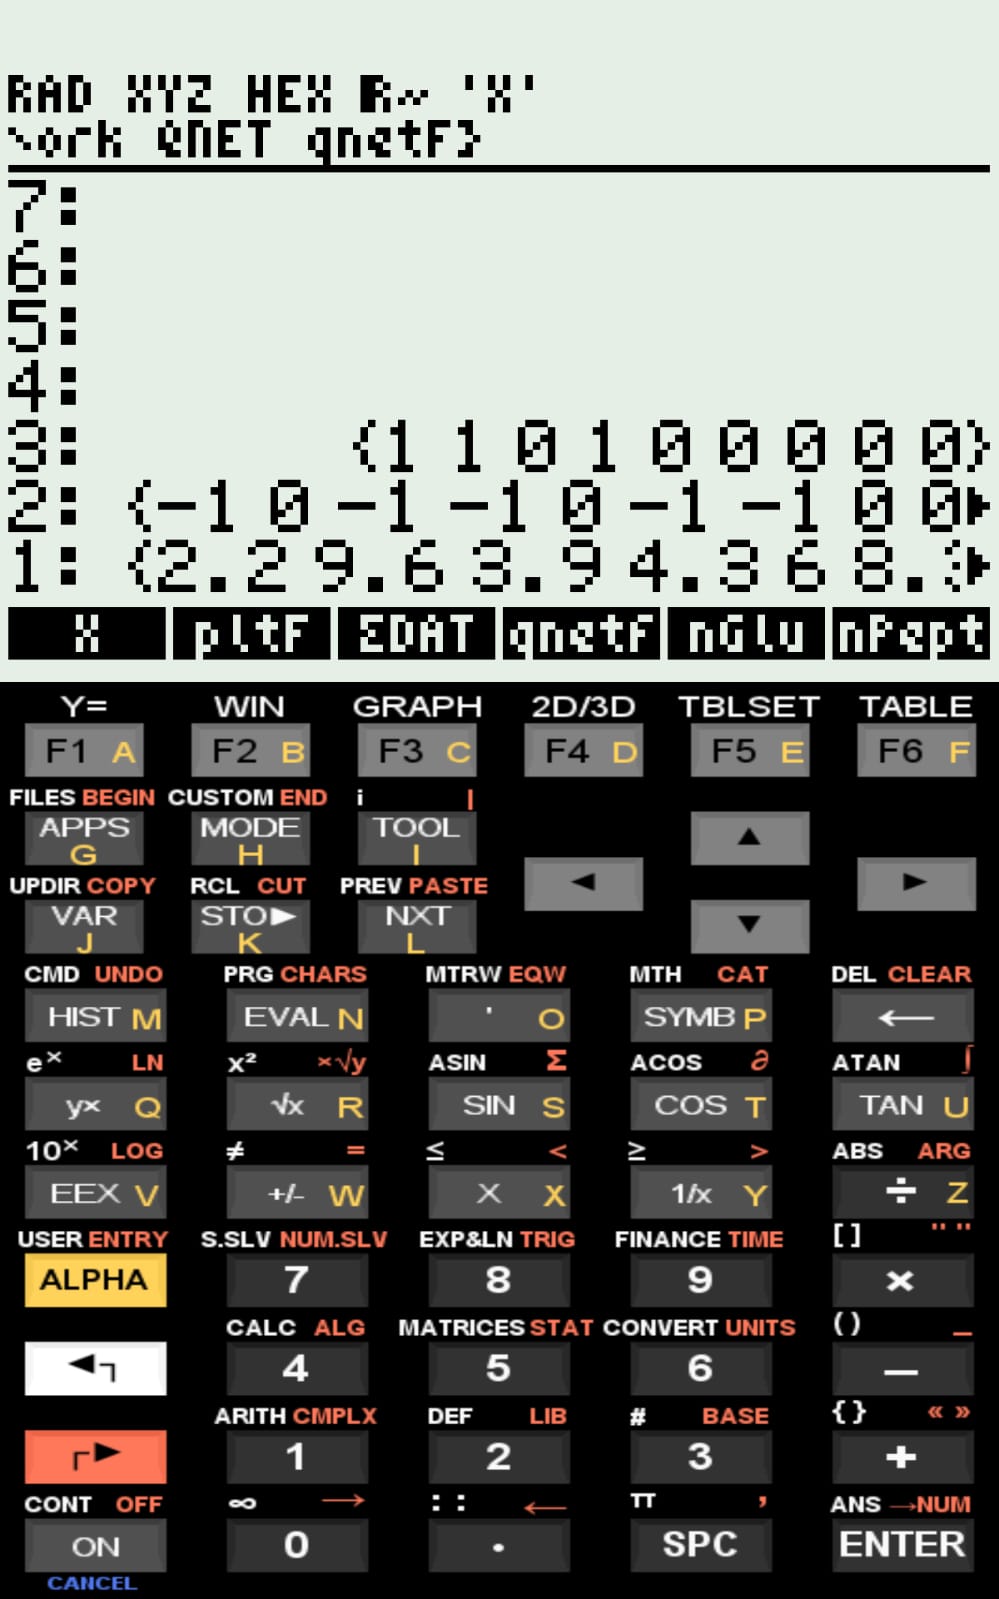
1. List with the number of ionizable groups (multiplicity):
Example: Glu (glutamate): {1 1 0 1 0 0 0 0 0}
2. List with "qb", i.e., the base-form charge of each ionizable group:
Example: Glu: {-1 0 -1 -1 0 -1 -1 0 0}
3. List with pKa values for each ionizable group:
{2.2 9.6 3.9 4.3 6.0 8.3 10.9 10.8 12.5}
...or in the order:
{C-t N-t Glu Asp His Cys Tyr Lys Arg}
# Outputs
Potentiometric titration curve of "qNet" as a function of pH (1 to 14)
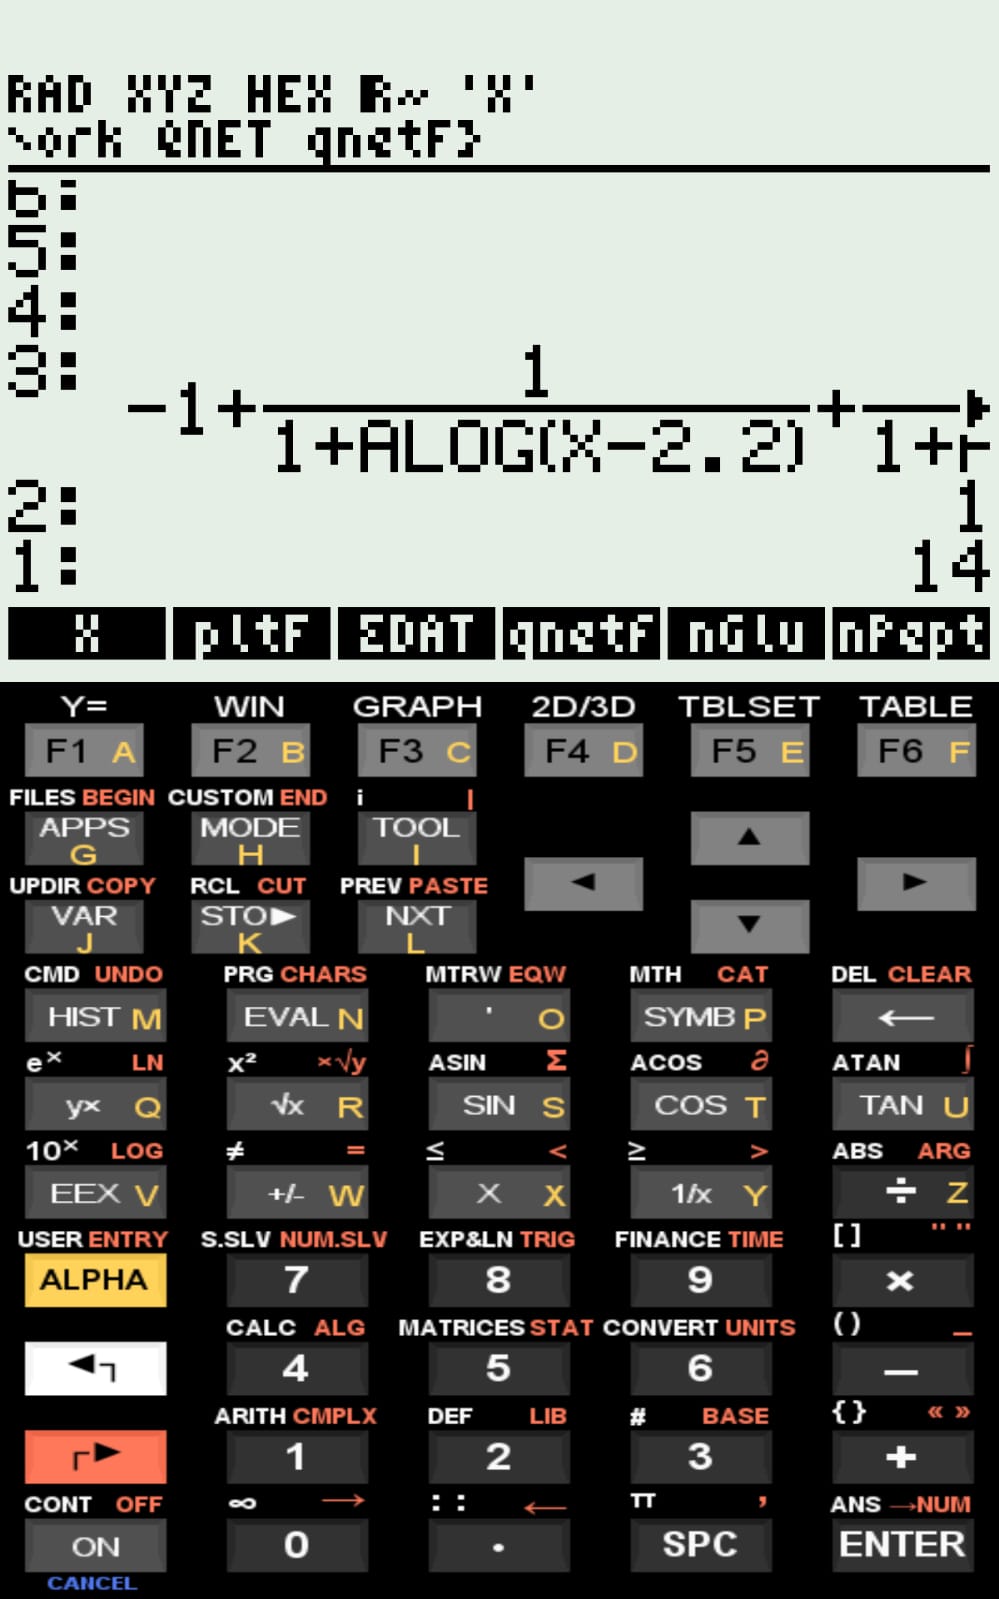
Function expression, and Xi and Xf values returned for re-plottingqNet — Titration Simulator and Isoelectric Point of Peptide Sequences
The isoelectric point (pI) is the pH value at which a molecule carries zero net electric charge under an electric field, i.e., its positive and negative charges cancel each other. Experimentally, it can be estimated by kinetic or electrokinetic measurements such as zeta potential, isoelectric focusing, or capillary electrophoresis.
In a related sense, the isoionic point refers to the same condition in the absence of an electric field, and may be inferred from potentiometric titration, viscosity, or directly from the structural information encoded in a monomeric sequence, as in the primary sequence of proteins. The program qNet simulates a titration curve for peptide (and protein) sequences.
In a related sense, the isoionic point refers to the same condition in the absence of an electric field, and may be inferred from potentiometric titration, viscosity, or directly from the structural information encoded in a monomeric sequence, as in the primary sequence of proteins. The program qNet simulates a titration curve for peptide (and protein) sequences.
1 Equation
The net charge of a compound, qNet, can be expressed as the sum of its acidic (qa) and basic (qb) contributions:
\[ qNet = qb + qa \]
Where:
- qb = charge in the basic form (+1, 0, or −1)
Considering the ionization of chemical groups via the Henderson–Hasselbalch equation:
\[ pH = pK_a + \log\left(\frac{A^-}{HA}\right) \]
Where:
- \(pK_a = -\log[H^+]\)
- HA = acid form concentration
- A\(^-\) = base form concentration
For a set of ionizable groups in a molecule, an operational expression for qNet can be written as:
\[ qNet=\sum_{i=1}^{n} \left( q_{b,i} + \frac{1}{1 + 10^{,pH - pK_i}} \right) \]
Thus, qNet is computed from the input values of \(q_{b,i}\), \(pK_i\), and \(n\) (the multiplicity/amount of ionizable groups of type i in the sequence).
2 Use and example
Plotting is performed by an independent program, plotF, which allows the user to plot a mathematical function by placing the expression on the stack along with the initial and final values of the independent variable.
In this way, qNet supports data input and generates a net-charge curve as a function of pH. For program execution, example inputs and outputs are:
3 Files
The figure below illustrates data entry and the execution of qNet using the examples included in the compressed file.
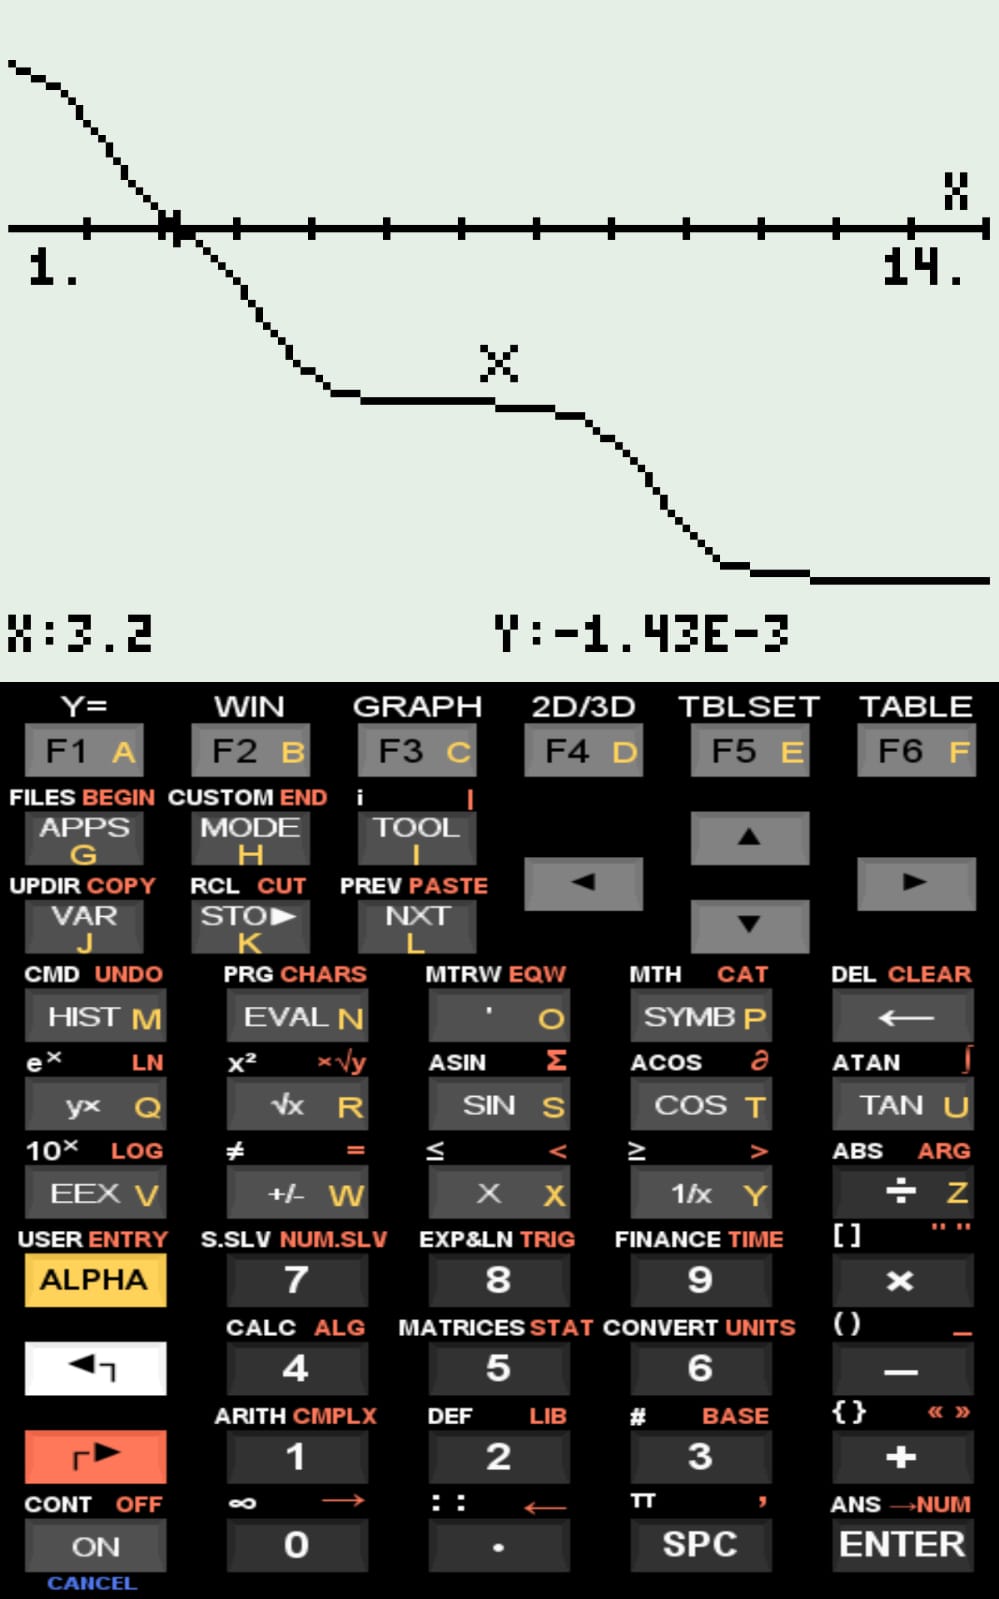
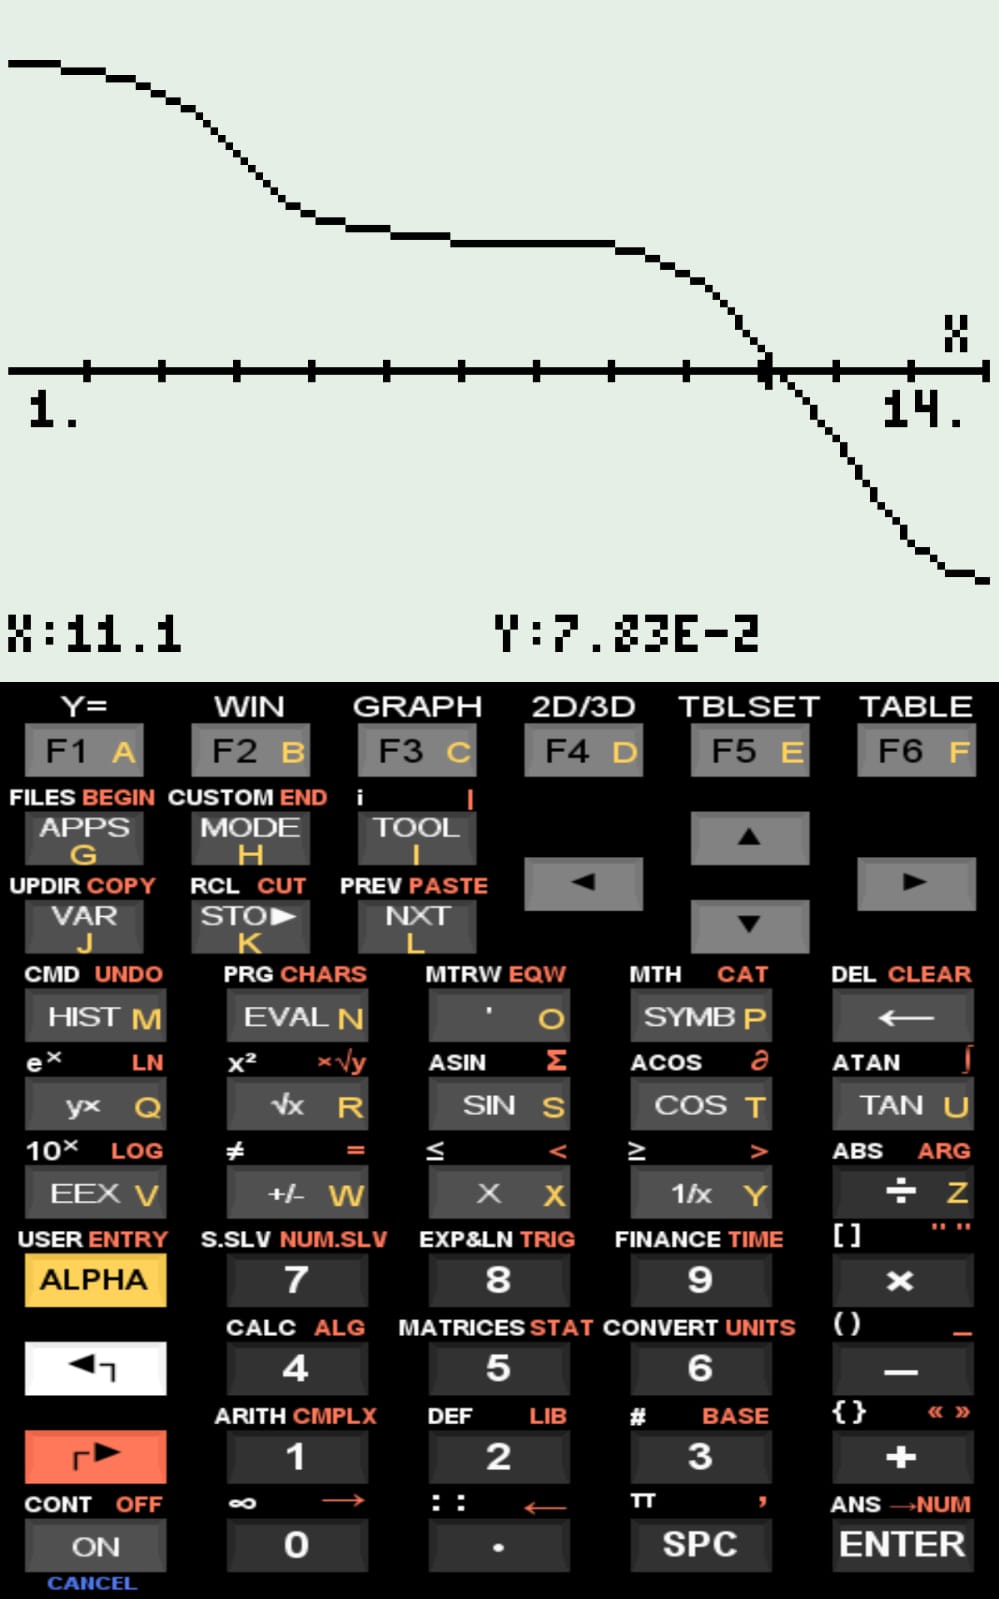
The simulated curves for the examples included in the compressed file, as well as the pI values computed by qNet, are consistent with values reported in the literature.
References
- Bloomfield, Victor. Computer Simulation and Data Analysis in Molecular Biology and Biophysics: An Introduction Using R. Springer, 2009.