# Input:
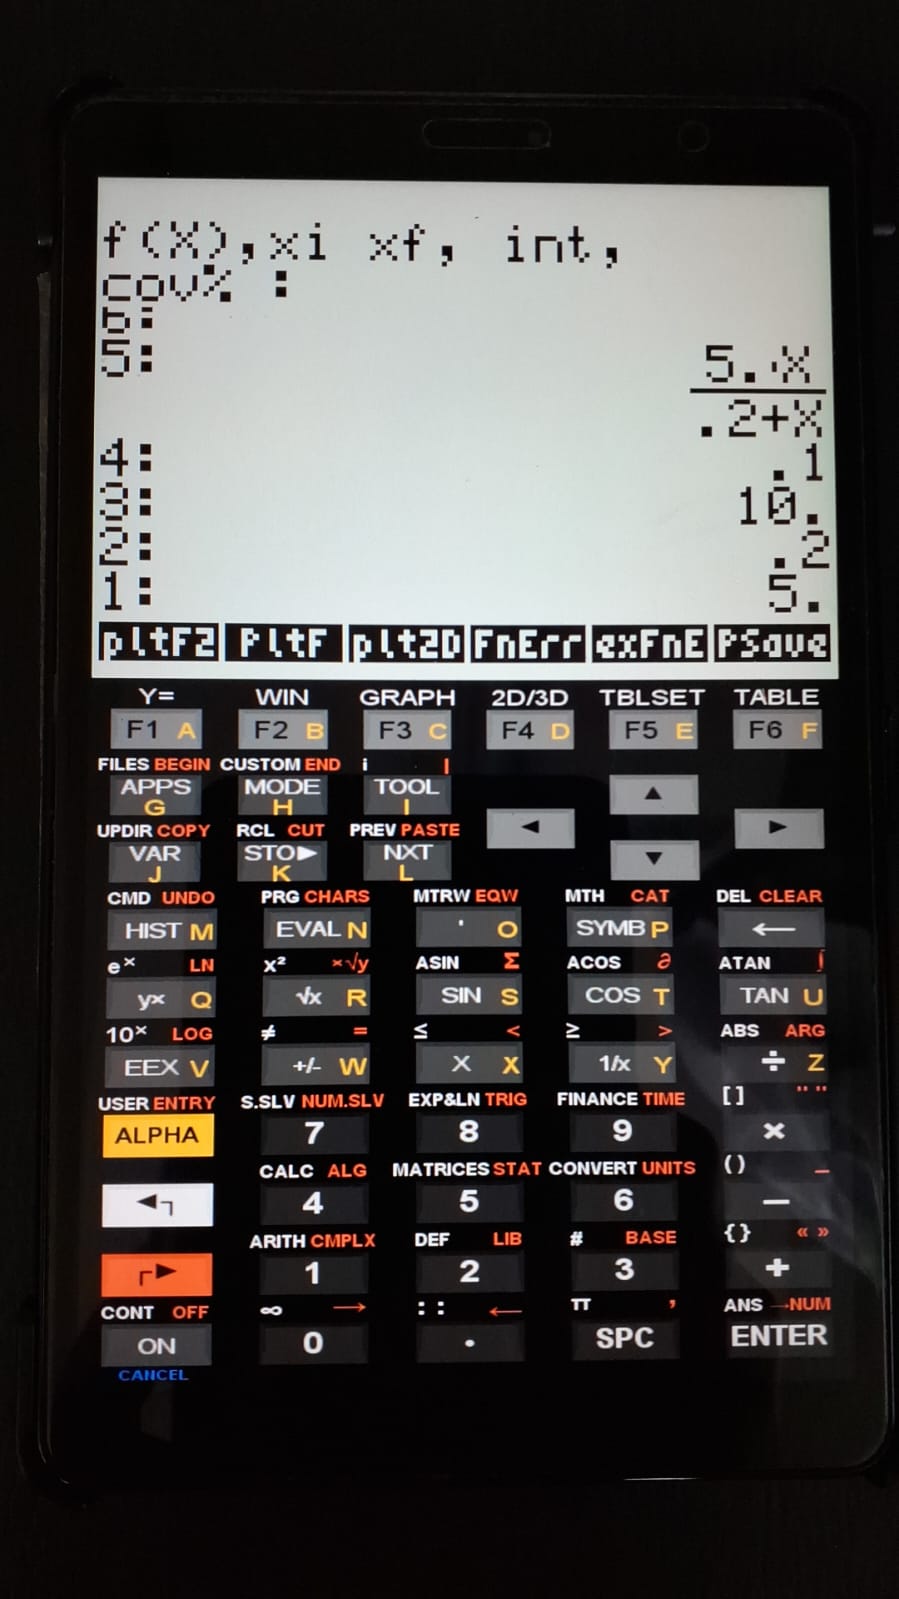
1. Select "PlotErr" to display the data request: "f(x), xi, xf, int, cov%";
2. Enter the equation as "f(x)";
3. Minimum x-value ("xi");
4. Maximum x-value ("xf");
5. Interval between points;
6. Coefficient of variation (CV%).
Note: If using the example included in the compressed file,
simply run EVAL to unpack the list containing the data.
# Output:
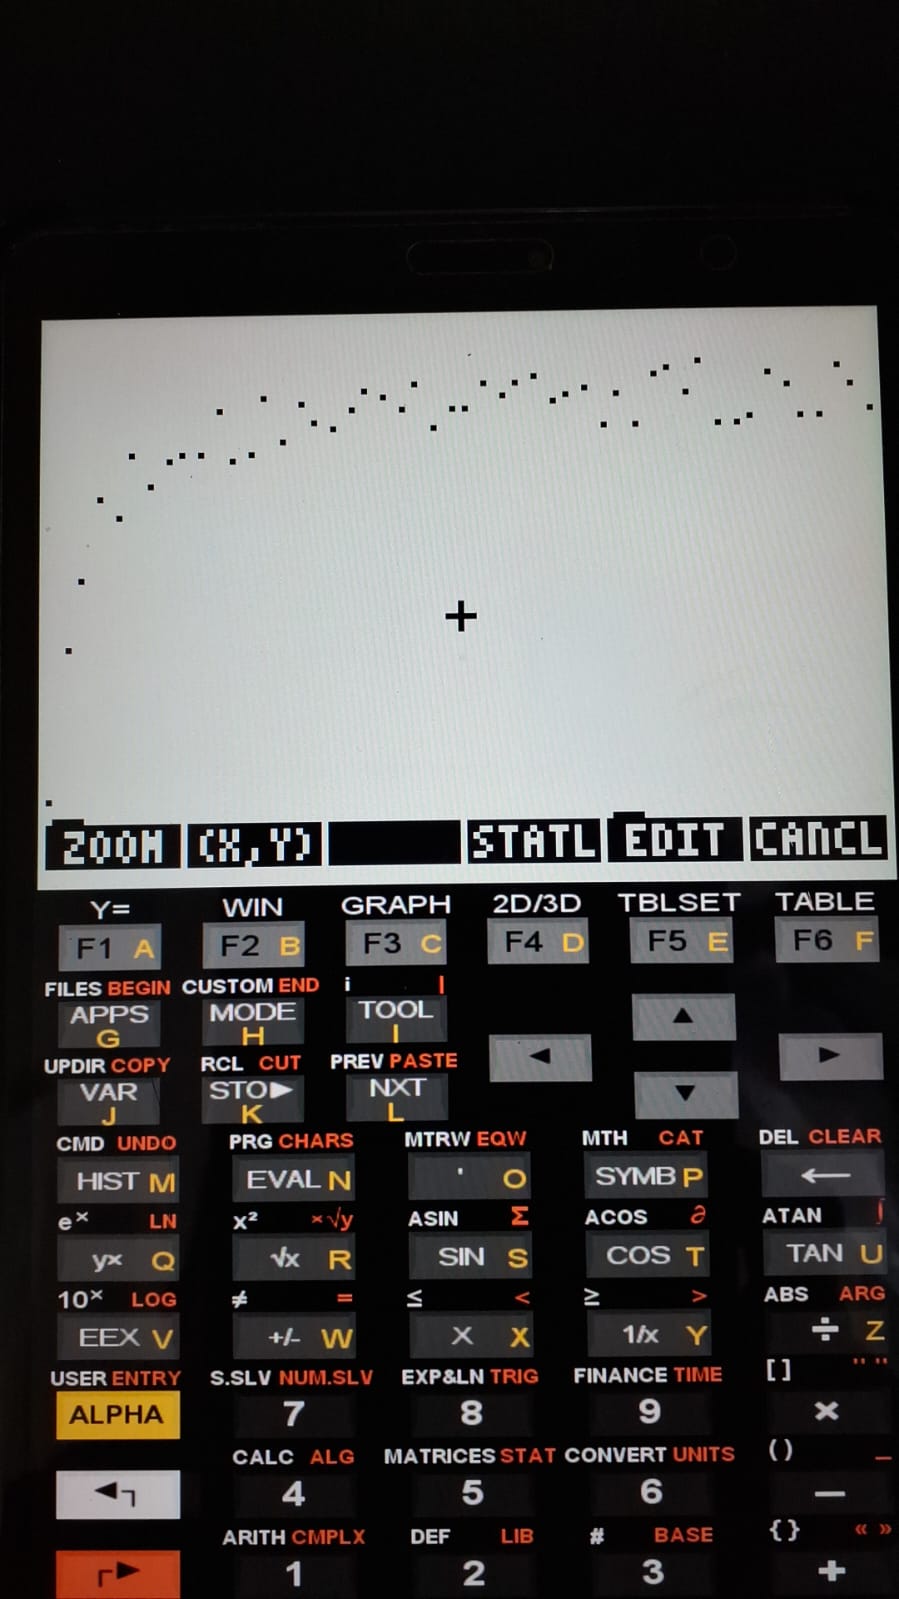
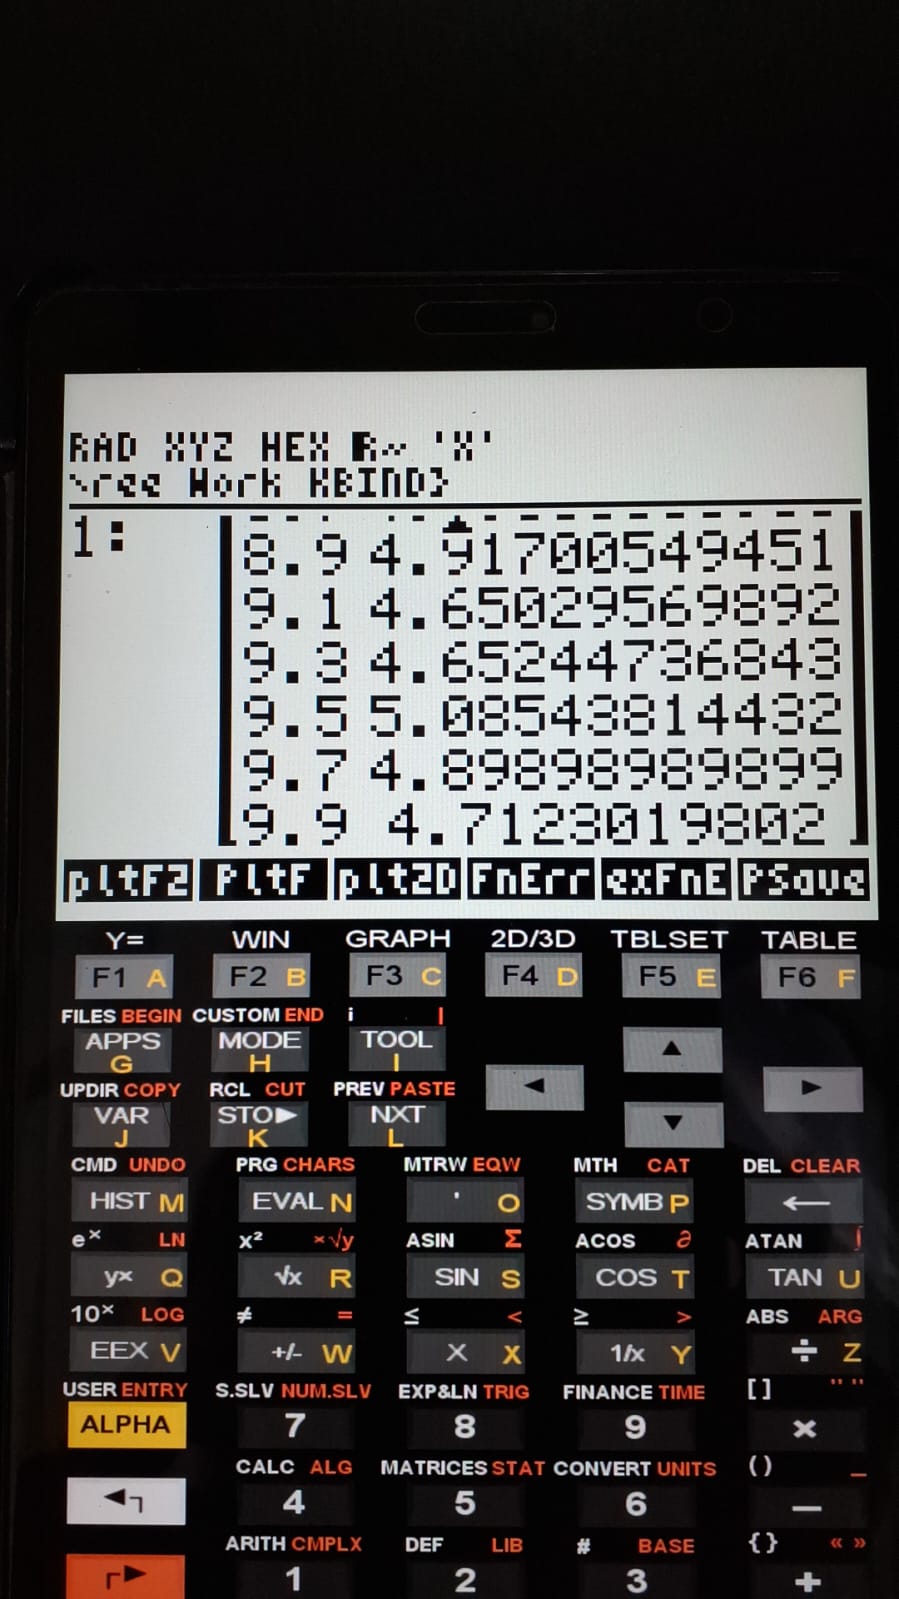
1. Scatter plot of points;
2. Data matrix containing the "x" and "y" values.PlotErr – Function Simulator with Random Error
The PlotErr program allows visualization of a scatter plot generated from a user-defined equation together with a specified coefficient of variation (CV%). This makes it possible to analyze the graphical profile of an equation under the influence of associated random errors.
1 Usage and example
The program uses the PROMPT command for data input.
The figures below illustrate the program using the provided example.
2 Files
3 Result