# Program logic:
1. Direct data input on the stack as lists, without the need for forms
(INFORM);
2. The number of iterations is requested at the initial input;
3. Only a single data input is required, unlike the original code;
4. The iteration index is displayed in the upper-left corner of the
graphics screen;
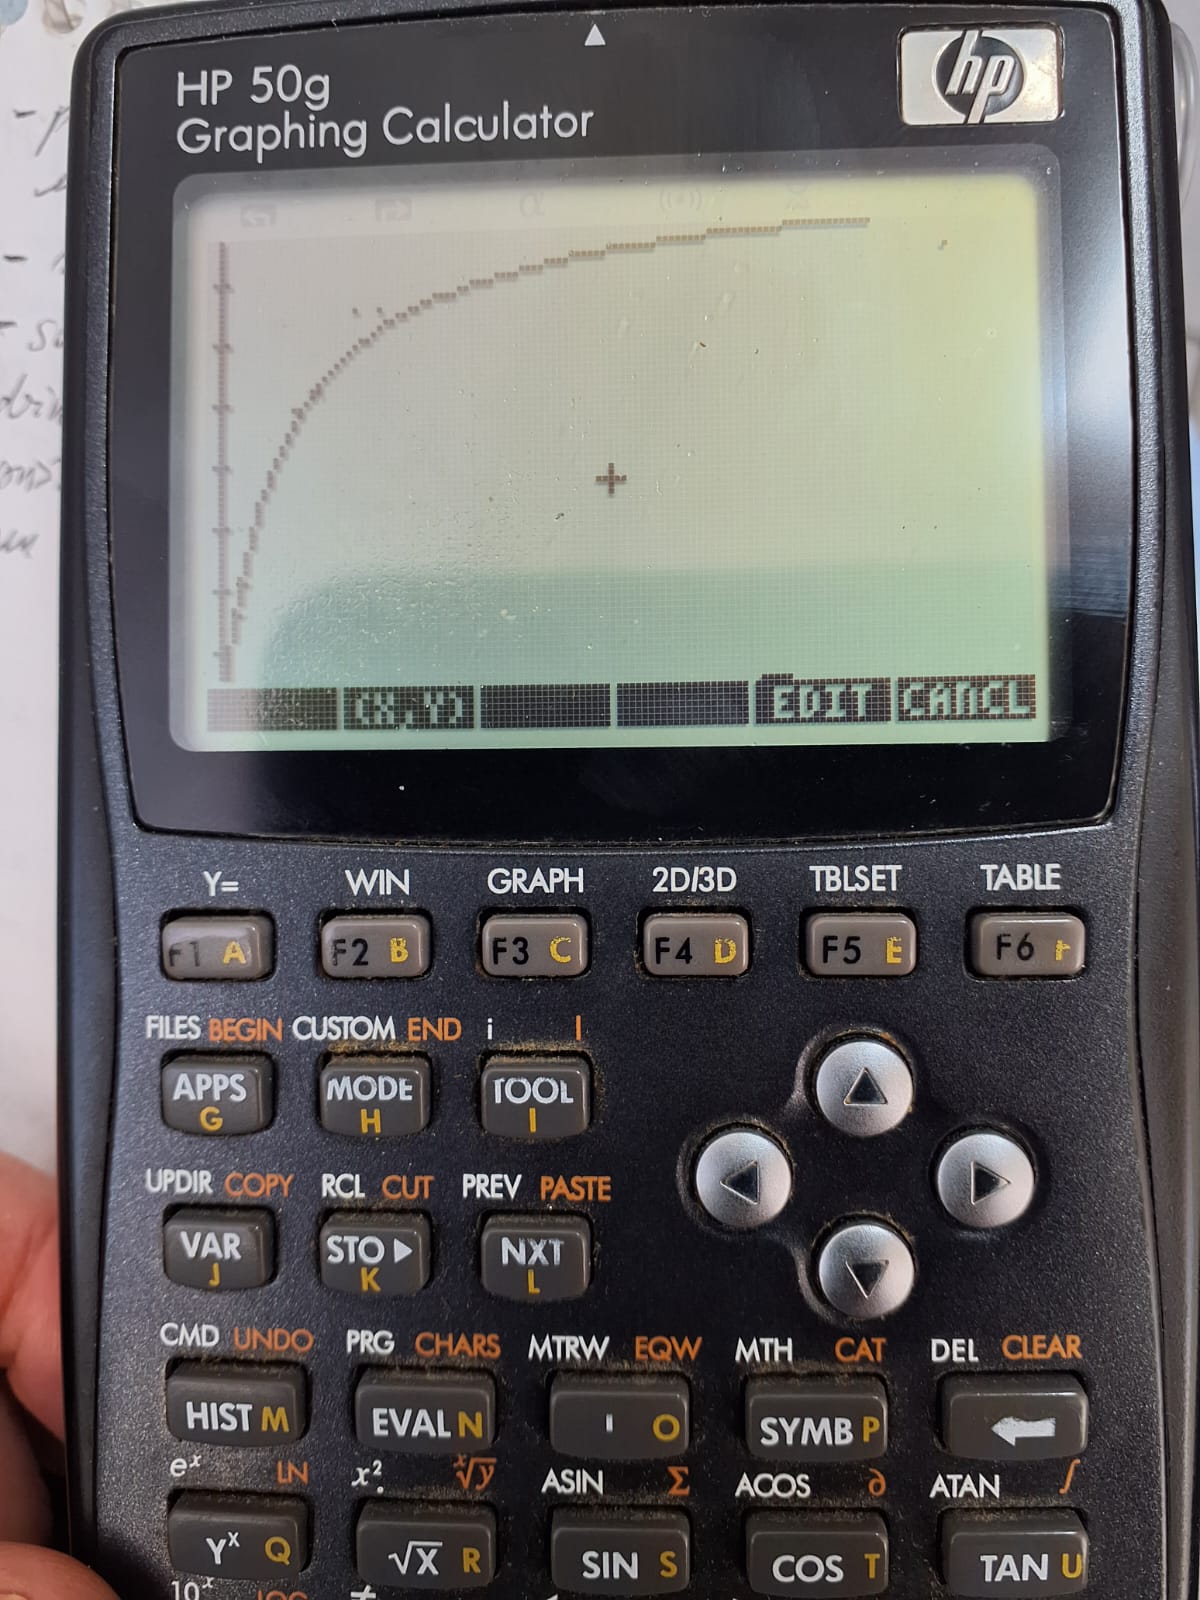
5. The program outputs:
a. covariance matrix;
b. estimated parameter values;
c. standard deviations of the parameters;
d. chi-square value of the regression;
e. list of xi values;
f. list of y_calc values;
g. graphics screen with experimental data points;
h. nonlinear fitted curve superimposed on the data points;
6. Uses the FDER and PGALL subroutines (Coffin, 1995) for symbolic
differentiation of the fitting function and for clearing previously
stored variables, respectively (the original program requires three
subprograms);
7. Plots experimental data using a routine that does not require ΣDAT
(PIXON).nlFIT – Nonlinear Regression and Enzyme Kinetics
This program allows nonlinear fitting using the Gauss–Newton method for a user-defined equation and data provided as lists. The program was adapted from the DATFIT code (Coffin, 1995) and is archived at the hpcalc.org portal at this link. Its main workflow and distinctive features are summarized below:
1 Files
To run the program, the following data must be entered sequentially on the stack:
# Data input

1. list of xi values: {x1 x2 ... xn};
2. list of yi values: {y1 y2 y3 ... yn};
3. list of weights: {w1 w2 w3 ... wn};
   Note: if no weighting is required, enter a unitary list {1 1 1 ...};
4. fitting function (e.g., Vm*x/(Km+x); Michaelis–Menten equation for
   enzyme kinetics);
   Note: the independent variable must be named "x";
5. list of parameters: {p1 p2};
   Note: in the example, p1 = Vm and p2 = Km;
6. desired number of iterations (e.g., 3).
The compressed file also includes an enzyme kinetics example to illustrate usage. The data correspond to the L. minor nitrogen uptake dataset, as presented in the
nlstools package of the statistical computing environment R.
# Program usage

1. Select EVAL on the example file to load the required input lists;
2. Run "nlFIT" to execute the program;

Note: for user-provided data, simply replace the lists.
2 Results
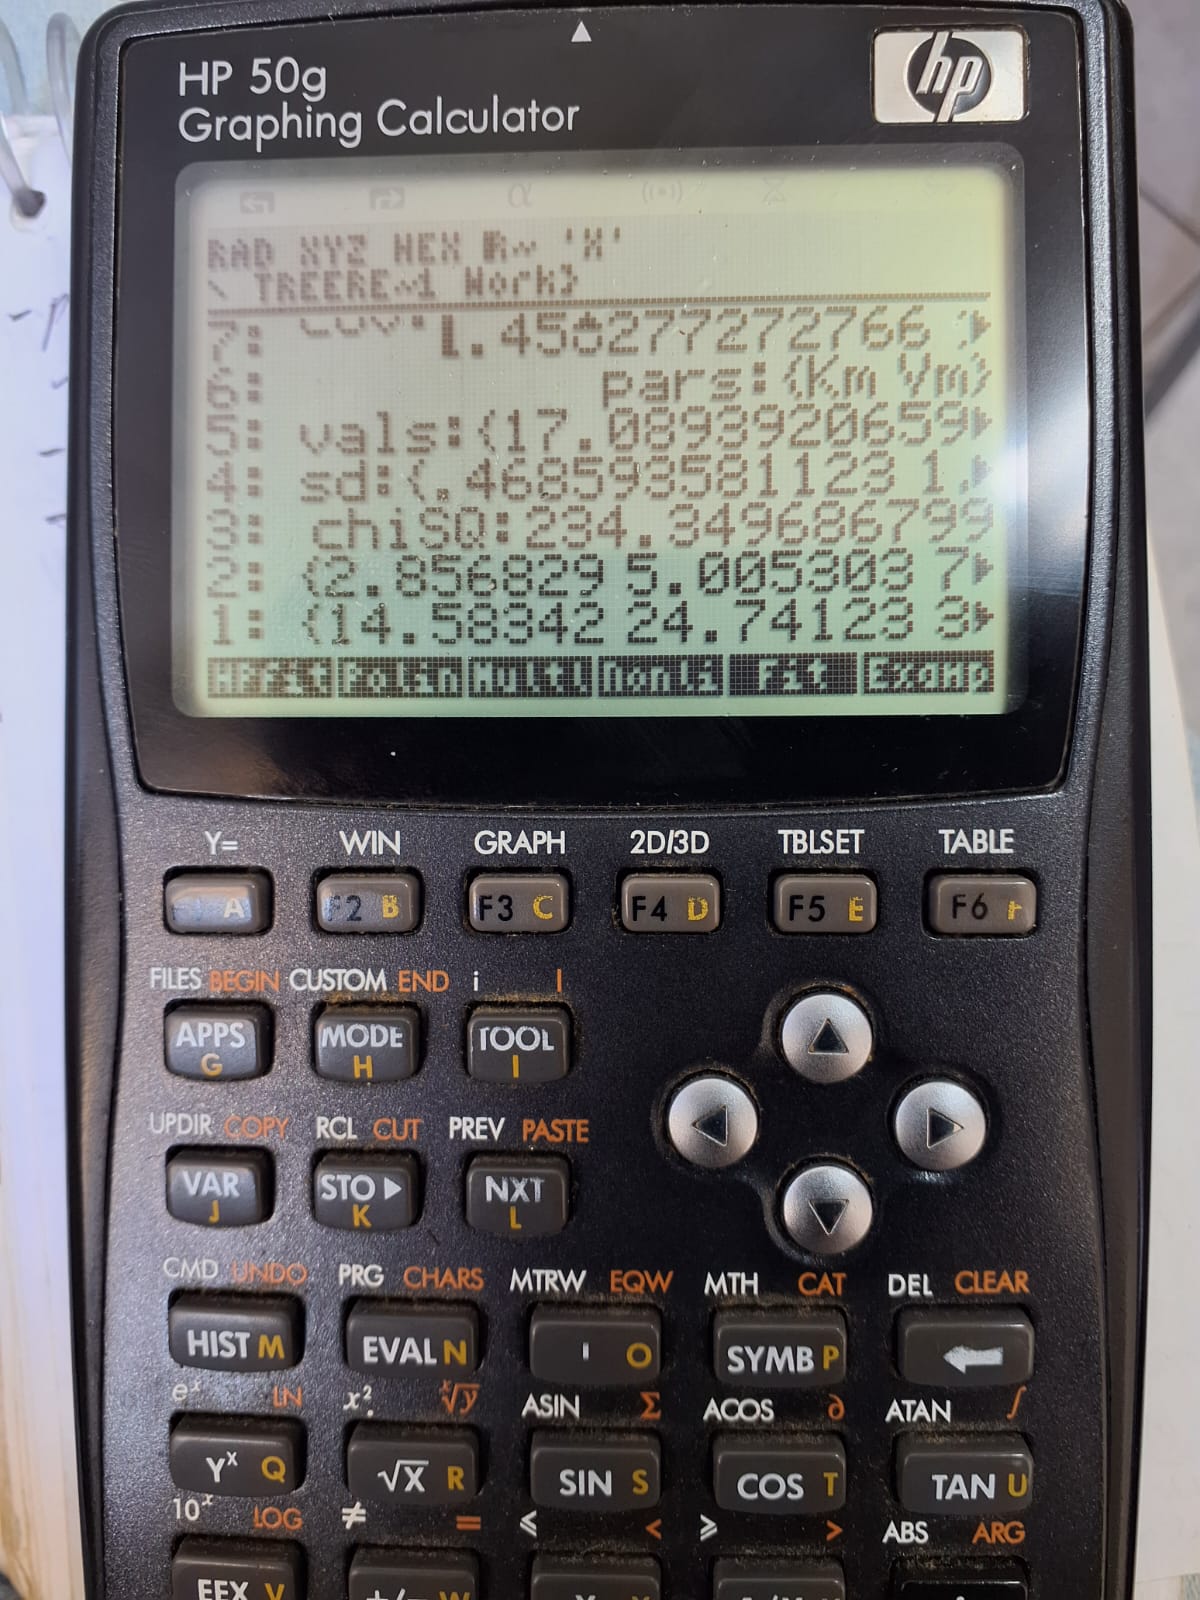
The nonlinear fitting results obtained with the nlFIT program are nearly identical to those obtained using the statistical software
R, as shown in the table below. Notably, nlFIT required only 3 iterations, compared to 7 iterations in R.| Parameter | nlFIT | R |
|---|---|---|
| Km | 17.089 ± 0.469 | 17.079 ± 2.953 |
| Vm | 126.055 ± 1.146 | 126.033 ± 7.173 |
| Iterations | 3 | 7 |
| \(\chi\)\(^{2}\) | 234.350 | 234.375 |
References
Coffin, Dan. Calculus on the HP 48G/GX. Grapevine Publications, 1995.