# Input:
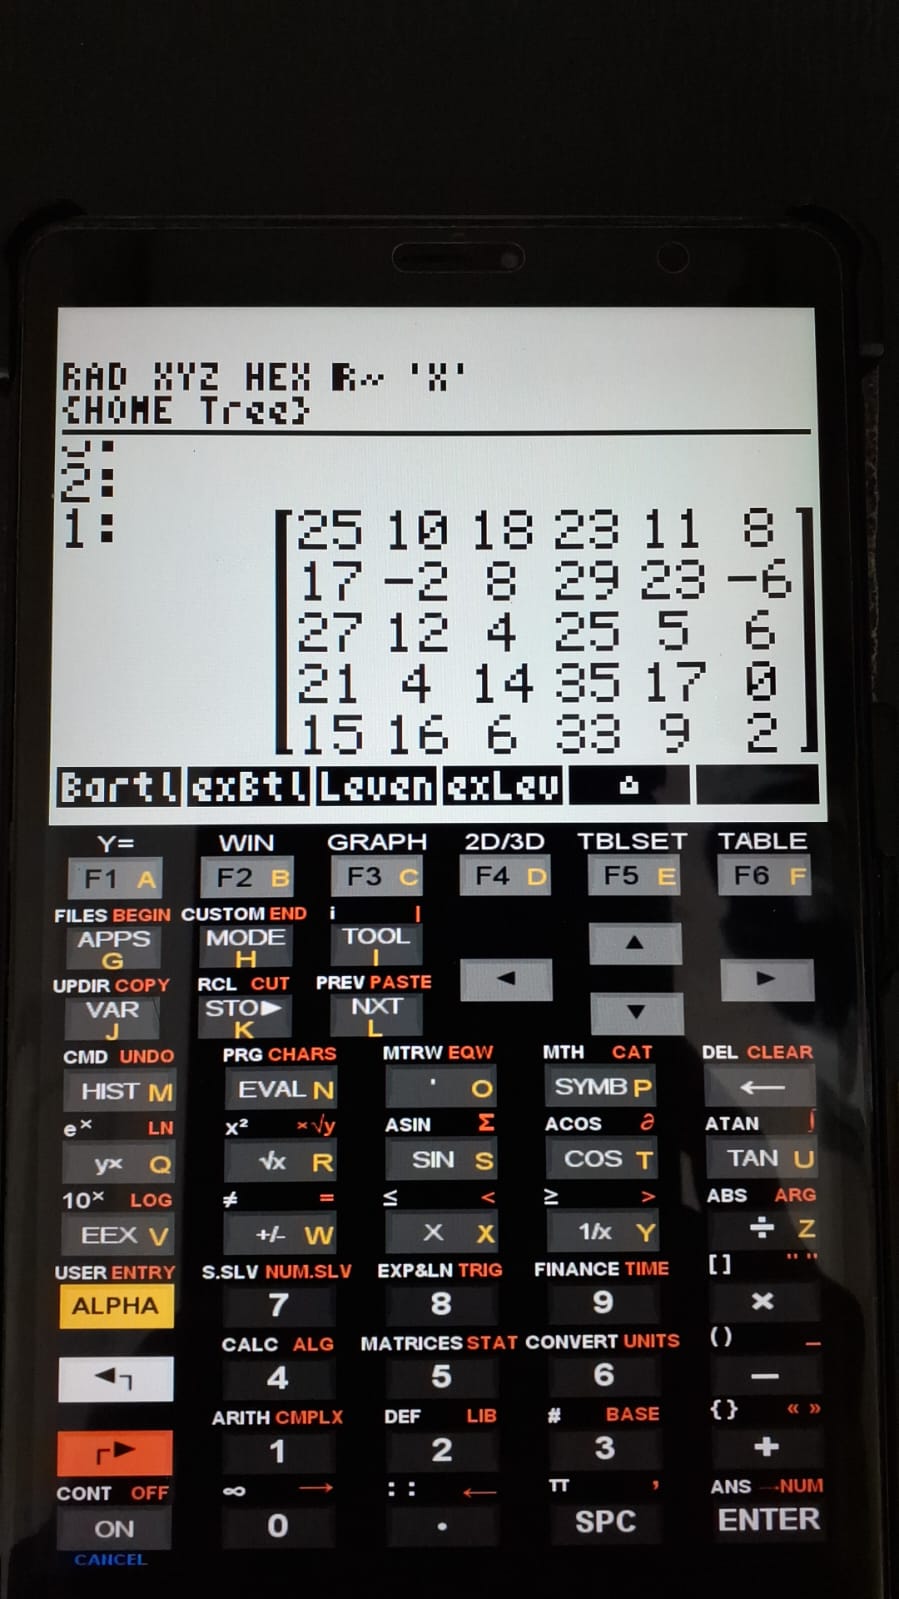
1. Enter the data matrix (column vectors);
2. Run "Lev1matrix".
# Output:
1. sqtr: treatment sum of squares;
2. sqr: residual sum of squares;
3. sqt: total sum of squares;
4. qmtr: treatment mean square;
5. qmr: residual mean square;
6. F: Snedecor’s F statistic;
7. pval: p-value of the testLevene’s Test for Homogeneity of Variances
Levene’s test evaluates whether a dataset with k groups presents homogeneous variances among its elements (Vieira, 2000). It is often used as an alternative to Bartlett’s test, which may mask differences when kurtosis is negative or detect differences that do not actually exist when kurtosis is positive. The classical formulation assumes an equal number of observations per treatment group.
1 Equation:
\[ W = \frac{(N - k)}{(k - 1)} \frac{\sum_{i=1}^{k} N_i \left( \bar{Z}*{i\cdot} - \bar{Z}*{\cdot\cdot} \right)^2} {\sum_{i=1}^{k} \sum_{j=1}^{N_i} \left( Z_{ij} - \bar{Z}_{i\cdot} \right)^2} \]
Where:
- W = Levene test statistic
- N = total number of observations
- k = number of groups
- N_i = number of observations in group i
- Z\(_{ij}\) = absolute deviation of observation j in group i from the group’s central measure
- \(\tilde{Y}_i\) = central measure of group i mean, median, or trimmed mean — depending on the version of the test
- \(\bar{Z}*{i\cdot}\) = mean of the Z*\({ij}\) values within group i
- \(\bar{Z}*{\cdot\cdot}\) = overall mean of the Z\(*{ij}\) values
2 Files:
3 Lev1matrix
The compressed file includes an ANOVA program that precedes the calculations, although its execution is not required, since it is incorporated as a subroutine of the main program (sANV1). It also includes a subroutine for converting lists into matrices, which is likewise not required for execution.
The Lev1matrix program, using a matrix containing the data (column vectors), returns the critical F value at 5% significance level (\(\alpha\) = 0.05) and the corresponding p-value.
4 Usage and example
The compressed file includes an example from Vieira (2000).
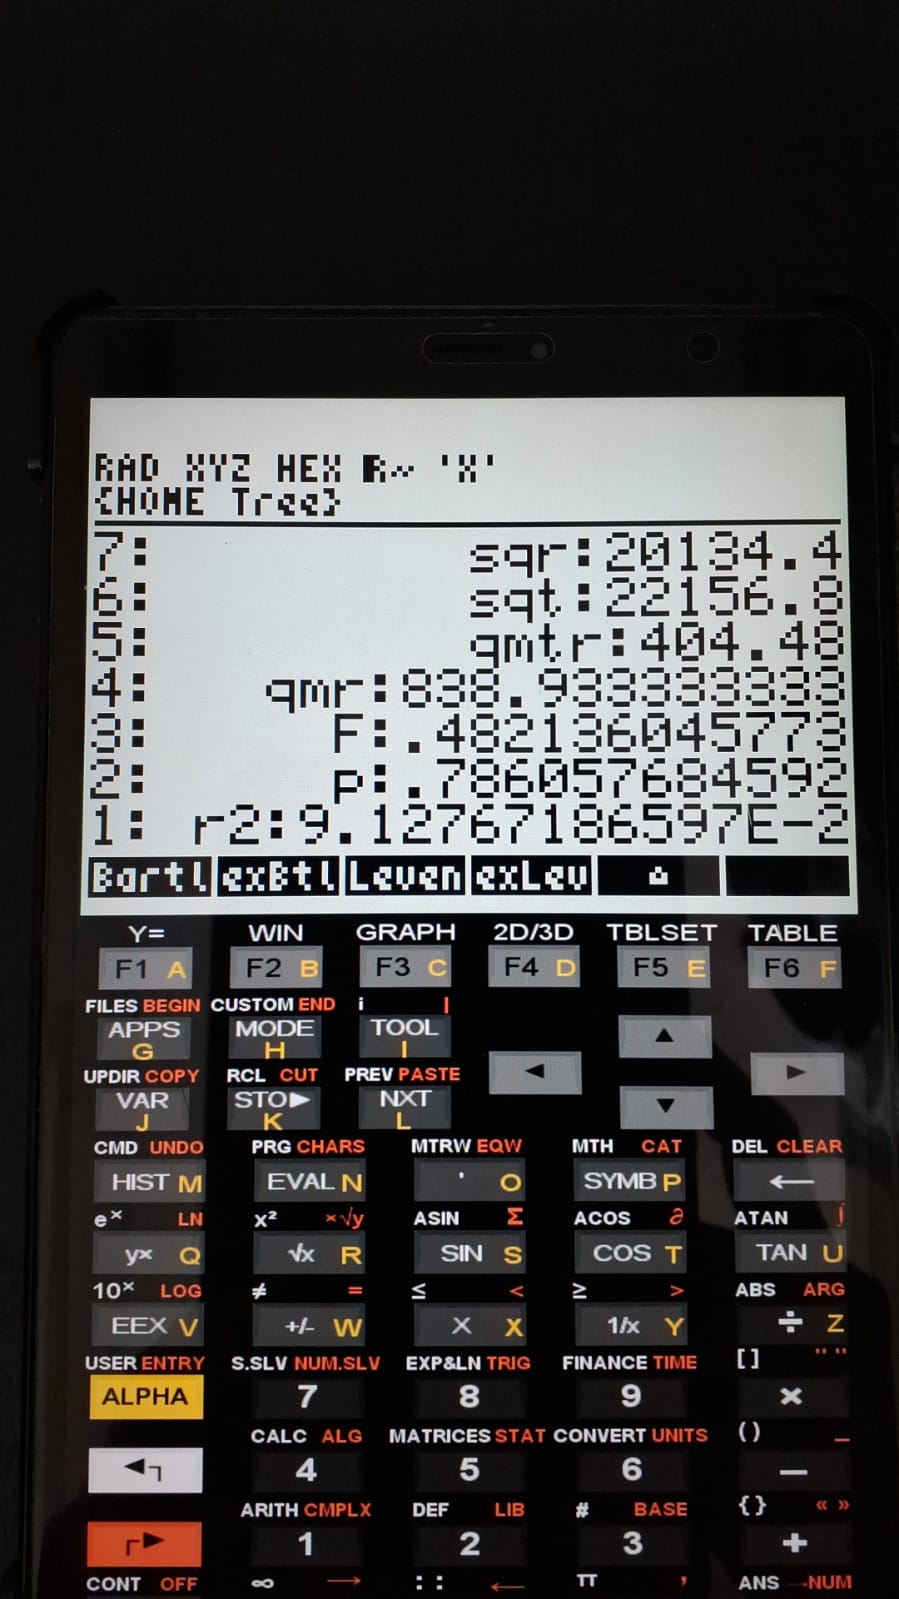
The obtained results match those reported in the reference source (Vieira, 2000).
5 References:
NIST. Engineering Statistics Handbook. Levene’s Test. Accessed Feb 12, 2026.
Vieira, Sônia. Analysis of Variance: ANOVA. Atlas Publishing, 2000.