1. Enter the data matrix (column vectors);
2. Run "Bart1matrix".Bartlett’s Test for Homogeneity of Variances
Bartlett’s test evaluates whether a dataset composed of k groups exhibits homogeneous variance among its elements. The logic of the test involves computing the T statistic and comparing it with the predicted value from the \(\chi^2\) distribution.
1 Equation:
\[ T = \frac{(N-k)\ln(s_p^2) - \sum_{i=1}^k (N_i-1)\ln(s_i^2)} {1 + \frac{1}{3(k-1)}\left(\sum_{i=1}^k \frac{1}{N_i-1}\right) - \frac{1}{N-k}} \]
With:
\[
s_p^2 = \sum_{i=1}^k (N_i-1)\frac{s_i^2}{N-k}
\]
Where:
- \(s_i^2\) = variance of group i;
- \(N_i\) = size of group i;
- \(N\) = total sample size;
- k = number of groups;
- \(s_p^2\) = pooled variance.
2 Files:
3 Bart1matrix
Based on a simple data matrix (column vectors), the program outputs the critical \(\chi^2\) value at 5% significance level (\(\alpha\) = 0.05), the T statistic, and the associated p-value.
4 Usage and example
The compressed file includes an example comparing the dry weight of control plant groups with two treatment groups. The data were obtained from the
datasets library of the statistical computing environment R — PlantGrowth. The figures below illustrate the execution of the program using this example dataset.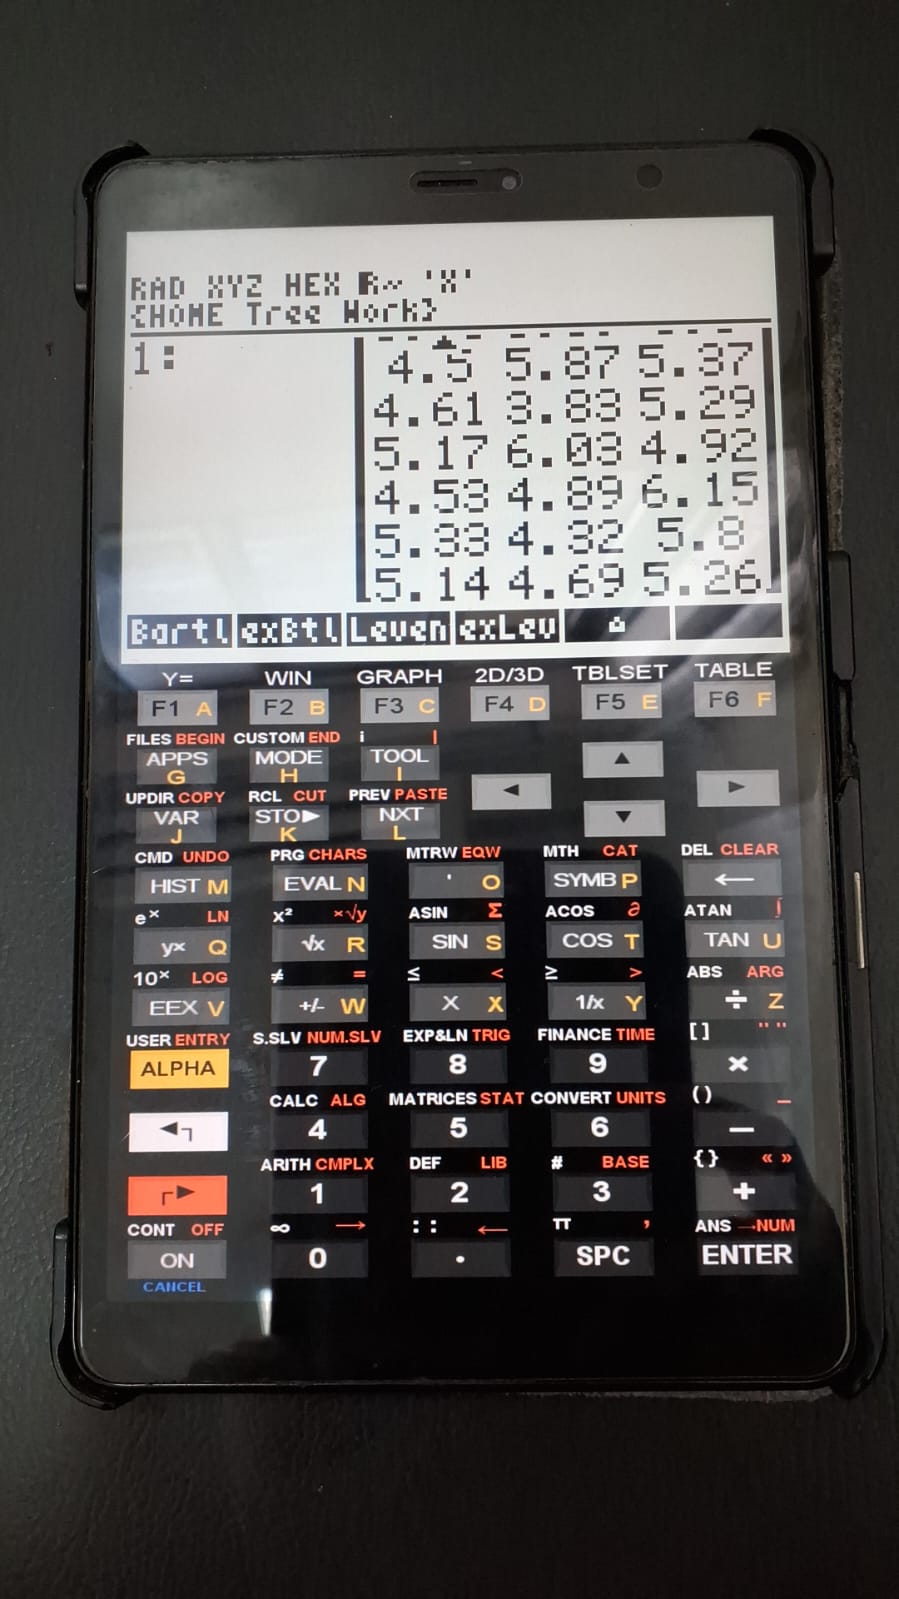
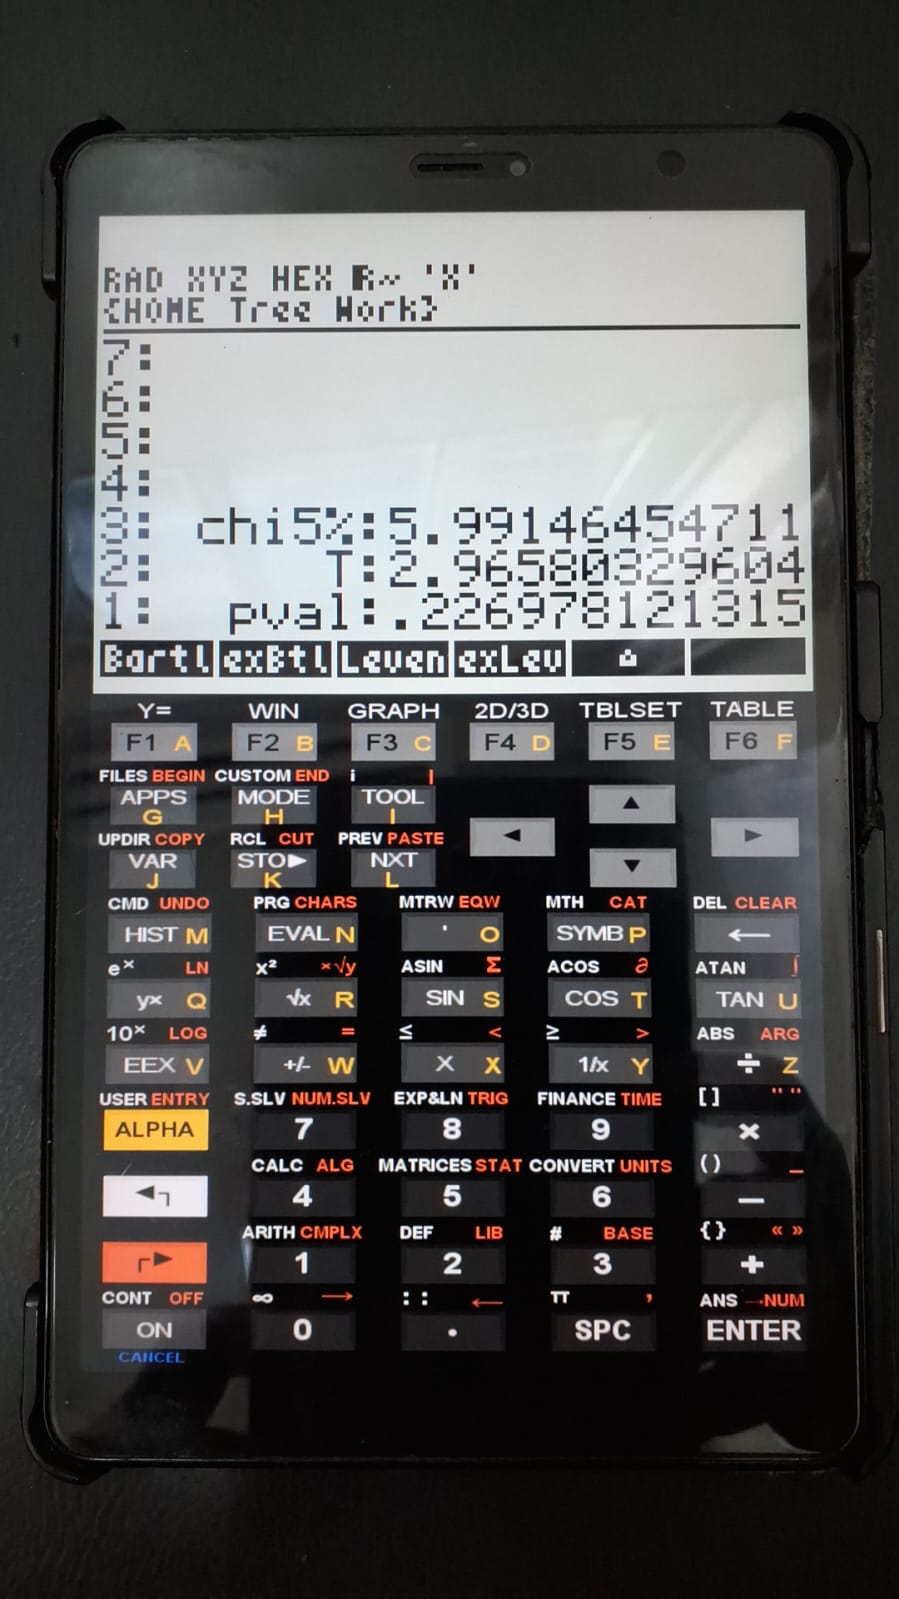
When compared with results obtained using R, the p-value was 0.2371 (\(\chi^2\) = 2.966).
5 References:
- NIST. Engineering Statistics Handbook. Bartlett’s Test. Available at: https://www.itl.nist.gov/div898/handbook/eda/section3/eda357.htm. Accessed on Feb 9, 2026.