"beta matrix:"

M  - overall mean;
A  - effect of factor A;
B  - effect of factor B;
AB - interaction effect.2² Factorial Design
Factorial design is an experimental statistical design used to assess to verify the significance of factors (e.g., pH, content, temperature, type) and levels in an experiment (e.g., value, type), without the need for complete trials with all samples. The most common designs involve two, three, or four levels The 22fat1matrix program was developed specifically to test two factors with 2 levels each.
1 Equation:
The statistical model for a 2² factorial experiment is:
\[
Y_{ijk} = \mu + \alpha_i + \beta_j + (\alpha\beta)_{ij} + \varepsilon_{ijk}
\]
Where:
- \(i = 1,2\) (levels of factor A)
- \(j = 1,2\) (levels of factor B)
- \(k = 1,2,\dots,r\) (replicas)
- \(\mu\) is the overall mean
- \(\alpha_i\) is the effect of factor A
- \(\beta_j\) is the effect of factor B
- \((\alpha\beta)_{ij}\) is the interaction effect
- \(\varepsilon_{ijk} \sim N(0,\sigma^2)\) is the experimental error
The above equation is also mirrored in the multiple linear regression model, as follows:
\[
M_(x1,x2)=\beta_0+\beta_1x_1+\beta_2x_2+\beta_{12}x_1x_2+error_{(x1,x2)}
\]
Thus, a 2² factorial experiment can be solved algebraically using the multilinear adjustment model. In this case, solving by matrix relation:
Solving by a matrix relationship:
\[ X^{T} \cdot y = \beta \]
Where:
- \(X^{T}\) = transpose of the planning coefficient matrix;
- \(y\) = response matrix of the experimental design;
- \(\beta\) = matrix of resulting coefficients.
The mathematical operation involved in factorial design resembles a multiple linear regression between variables, although using a planning coefficient matrix translated directly from the experimental values (Neto, 1996).
The resulting \(\beta\) matrix comprises:
2 Files:
3 Usage and example
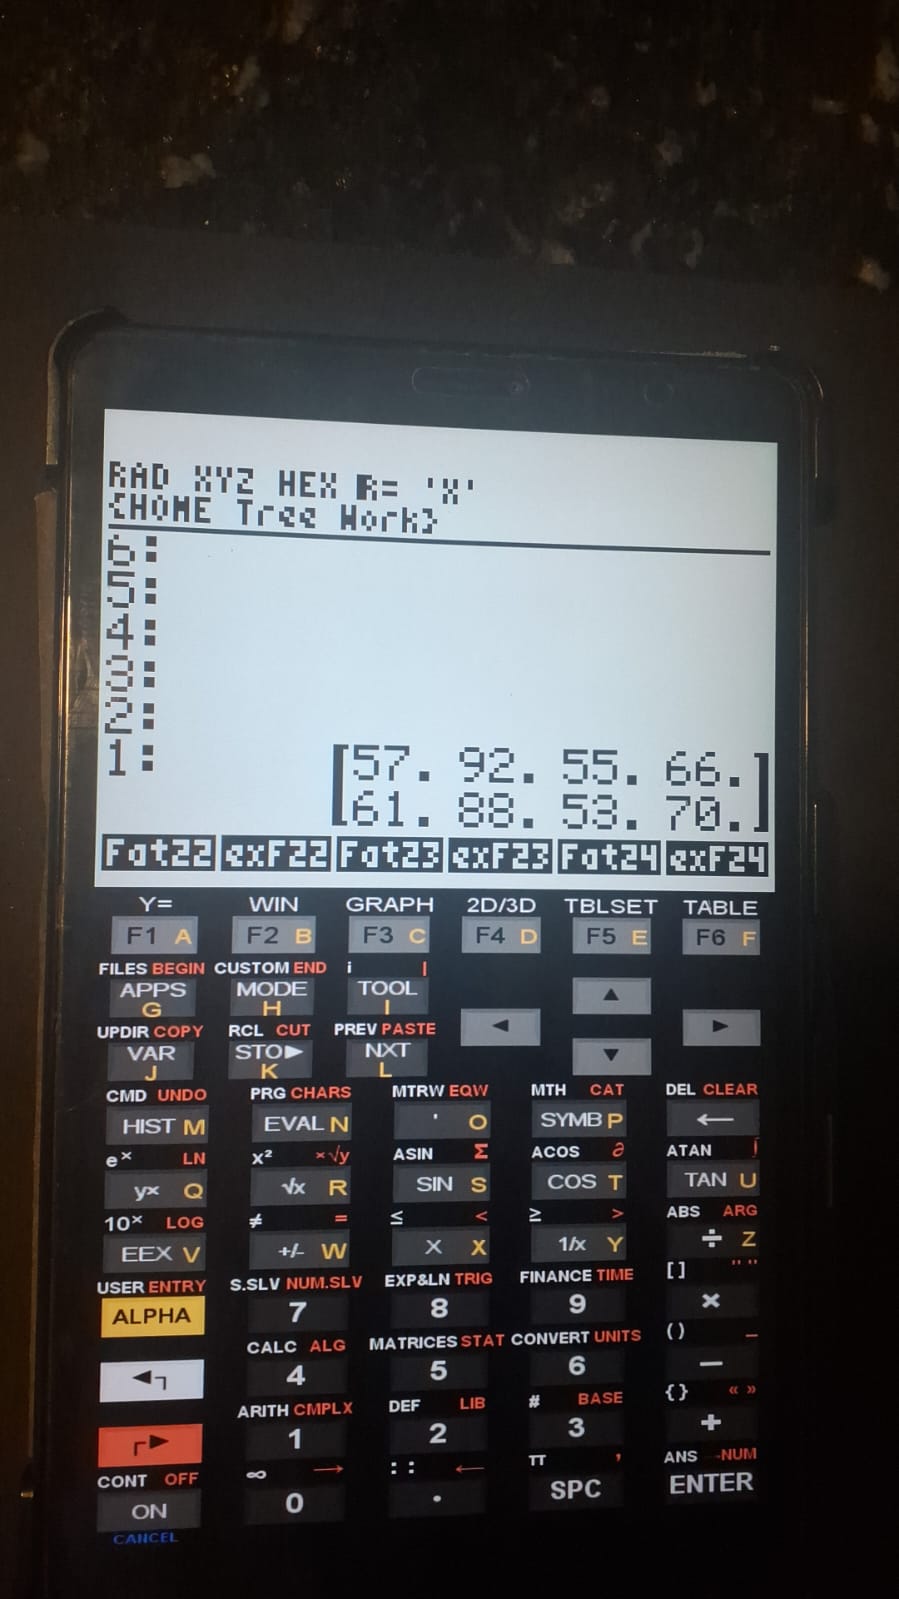
# Input:
1. Enter the matrix containing the dataset;
2. Run the program "22fat1matrix".

# Output:
1. Values of M, A, B, and AB.
Note: The ex22fat file included in 22fat1matrix.zip refers only to the planning matrix of the example provided. For user-defined data, a new planning matrix must be constructed and stored in the variable ex22fat (Neto et al., 1996).
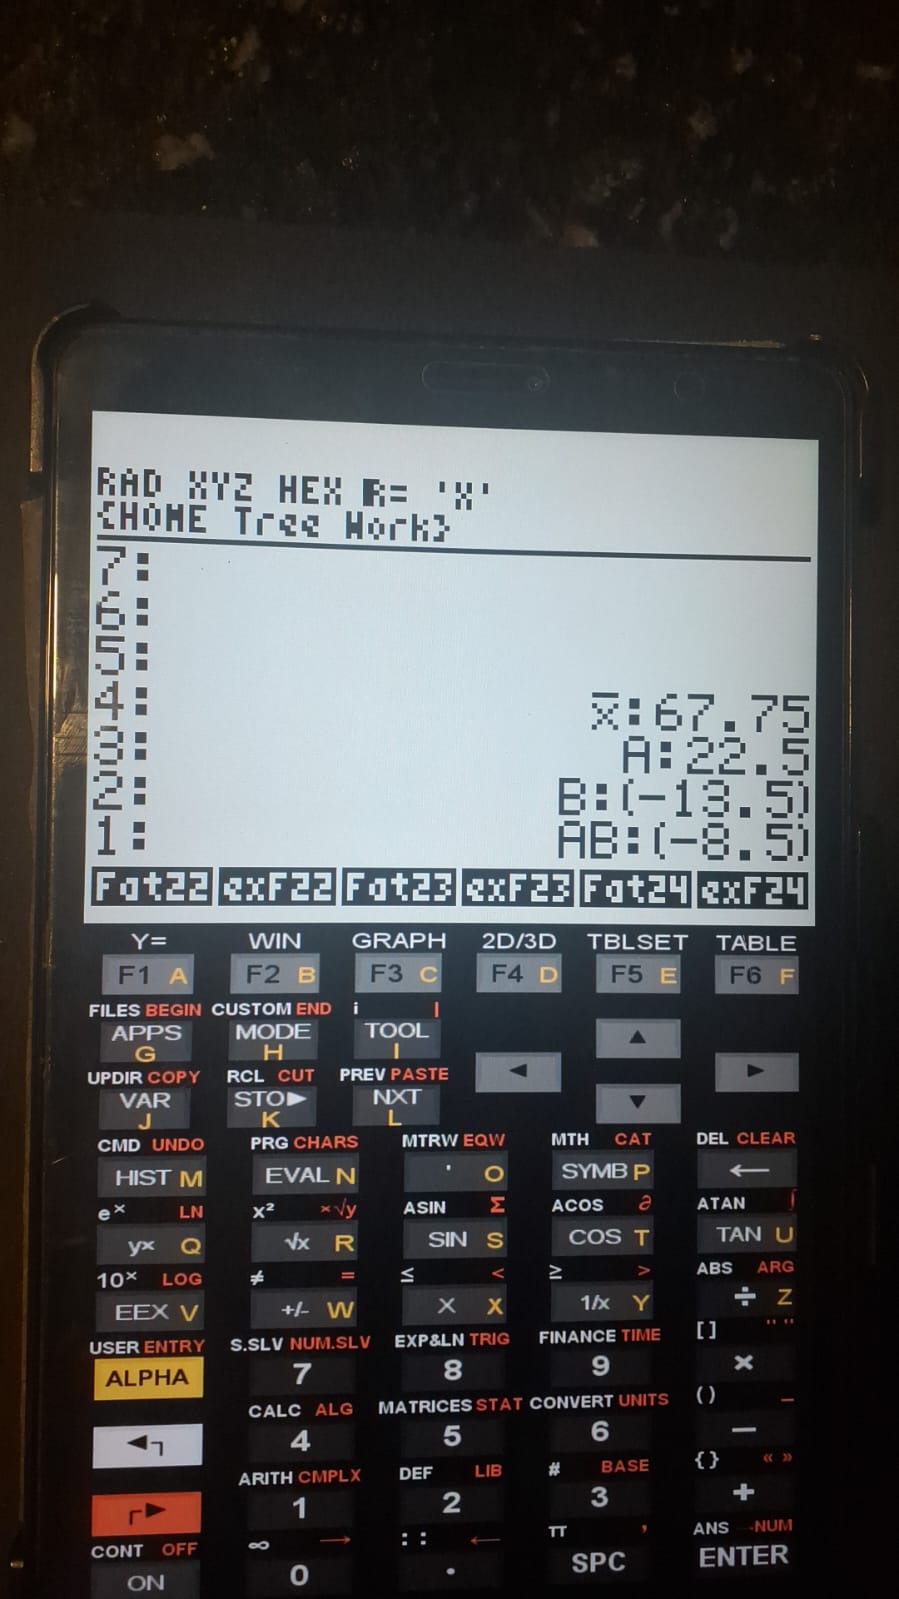
In the example (Neto et al., 1995), factor A corresponds to the reaction temperature, whereas factor B represents the type of catalyst used in a chemical reaction. The values in the data matrix (input) correspond to reaction yield. In summary, the results indicate that increasing temperature led to a proportional increase in yield (A = 22.5), particularly when using catalyst A (while B was reduced), whereas changing the catalyst negatively affected yield (B = −13.5). The results are identical to those reported in the reference source (Neto et al., 1996).
4 References:
- Neto, B. B., Scarmino, I. S., Bruns, R. E. Design and Optimization of Experiments. 2nd ed., Unicamp Press, 1996.